
In 2022 Carvana lost about $4.1 million of operating income every calendar day, weekends included. Add it up and the year closed at a $1.50 billion operating loss on $13.6 billion of revenue. Three years later the same company earned $1.88 billion from operations on $20.3 billion, and the stock sits at $65.
That is a genuine turnaround, and nobody serious disputes it. The open question is the one in the title. At 34.4 times trailing earnings, 33.1% below its 52-week high of $97, is Carvana still cheap? My answer is no on the ordinary measures, and only conditionally yes on growth. The stock is priced for a business that keeps compounding revenue near 50% while holding a margin it reached only two years ago.
How close it came
The income statement from FY2020 to FY2023 reads like a slow bleed. Operating income was negative $0.33 billion in FY2020, negative $0.10 billion in FY2021, then negative $1.50 billion in FY2022, when the operating margin hit -11.0%. Net income that year was a loss of $2.89 billion and diluted EPS was negative $3.15. Across the four years the cumulative operating loss was $2.01 billion.
The FY2023 response was to shrink. Revenue fell 21% to $10.8 billion, and the operating margin climbed back to -0.7%, which is breakeven for practical purposes. Gross margin moved from 9.2% to 16.0% in the same year. That is the sequence to remember: a revenue decline, a margin recovery, and only then a growth restart.
I would not read that shrinkage as weakness. A company that sells $10.8 billion of cars at a small profit is in better health than one selling $13.6 billion at a loss of 11 cents on the dollar. The financials tab has the full run if you want the line items.
What the recovery looks like in dollars
FY2024 brought $13.7 billion of revenue and a 7.2% operating margin, or $0.99 billion. FY2025 brought $20.3 billion, up 49%, and a 9.3% margin. Two years of operating income added to $2.87 billion, more than the $2.01 billion lost across the four bad years before. Cumulatively the ledger has already turned.
Net income tells the same story with larger numbers. It went from a loss of $2.89 billion in FY2022 to a gain of $1.9 billion in FY2025, and diluted EPS of $1.69 sits against negative $3.15 three years earlier. One quirk deserves a line. FY2025 net income of $1.90 billion is a hair above operating income of $1.88 billion, which means below-the-line items and taxes left net profit about level with operating profit. I would not build a thesis on that, since it can reverse in any year.
One margin conflict in the data needs flagging. Our data also carries an EBIT margin of -1.9% for FY2025, which cannot be squared with a positive $1.88 billion operating income. I use operating income divided by revenue throughout, because it ties to the reported figure.
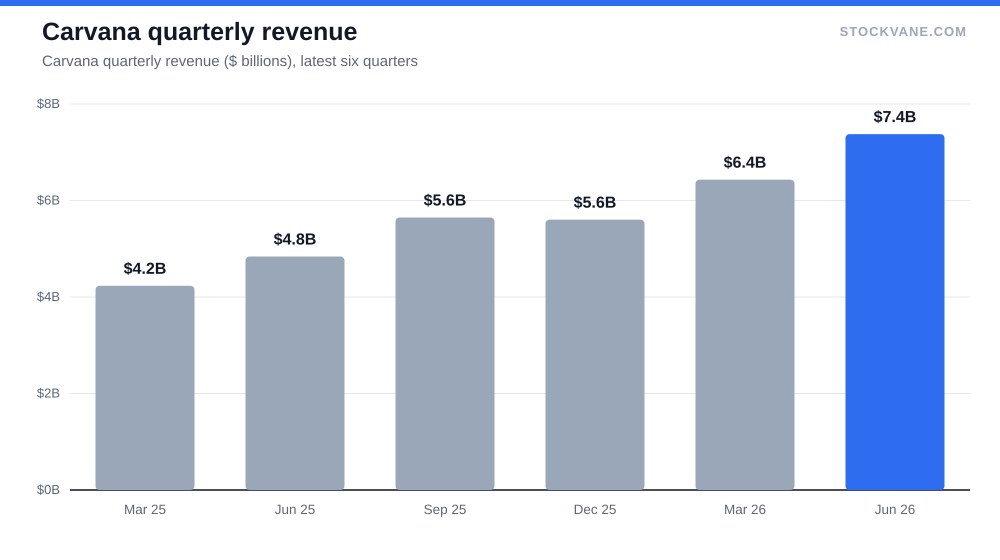
The latest quarter, the June period reported on 2026-07-29, brought $7.4 billion of revenue. That is 52% above the same quarter a year earlier and 15% above the prior quarter. Quarterly growth has run at 55%, 58%, 52% and 52% over the last four reports. Annualized, the latest quarter implies $29.5 billion of revenue, roughly 45% above FY2025.
| Metric | Value | Context |
|---|---|---|
| Price (approx.) | $65.11 | 52-week range $54 to $97 |
| P/E (TTM) | 34.4x | Five-year average -524.0x |
| Price-to-sales | 2.0x | Five-year average 1.4x |
| Analyst ratings | 76% buy, 24% hold | 17 analysts; average target $85 |
Is it still cheap?
Start with the ordinary yardsticks. The trailing P/E is 34.4, on trailing EPS of $1.89. Our data’s industry average P/E is 20.7, and Carvana’s current multiple of 36.6 on the valuation tab sits at 57th percentile of its own five-year range. The five-year average P/E is meaningless here, because -524.0 is what you get when years of losses feed an average. Ignore it.
The price-to-sales ratio is cleaner. Carvana trades at 2.0 times sales against a five-year average of 1.4 and a band of 0.3 to 2.6. It is closer to the top of its history than the bottom. The industry average is 0.5, so investors pay about four times the sector multiple for each revenue dollar. On book value the picture flips: the current 12.4 times compares with a five-year average of 24.9, but book value was tiny during the crisis, so I place little weight on it.
Then comes the awkward number. Consensus forward EPS is $1.59, below the trailing $1.89, which implies a decline of -16%, and puts the forward P/E at 40.9. I cannot tell from the data why forward earnings sit below trailing. It could mean analysts expect a step-down in profitability. It could also mean the trailing figure contains one-time items, and I am not going to invent a reason. What I can say is that a stock cannot be called cheap when the market-implied path for earnings points down while the multiple sits above 40.
Compare it with a stock I looked at earlier. Palantir at a valuation that only works under specific growth is the closest parallel on this site: a business where the price already assumes the good outcome, and the analysis is about how much of it is left. Carvana’s version is less extreme but similar in structure.
What the bulls have right
Revenue growth of 49% in FY2025 came on a base of $13.7 billion, so it is not a small-number effect. If the June quarter’s $7.4 billion holds, the annualized total of $29.5 billion would carry the company well past $25 billion even without further sequential gains.
Analysts see it. Seventeen cover the stock, 76% rate it a buy, and the average target of $85 is 31% above the current price. Even the lowest target, $70, sits 8% above it. The highest, $120, would be an 84% gain. No analyst in the sample is below the price, which describes sentiment among professionals, not the direction of the stock.
There is also a fair argument that the market is using the wrong yardstick. If operating margin were to move from 9.3% toward the low teens on the same volume trajectory, a trailing multiple in the mid-30s would compress quickly. A company earning 9.3 cents on each revenue dollar at $20 billion is a different animal from one earning the same at $2 billion. Scale is already visible: FY2025 revenue was 1.5 times FY2022’s.
What the bears have right
The stock has already given back a lot. It is 33.1% below its high, only 20% above its 52-week low of $54, and the market capitalization is $46.9 billion. That is roughly 25 times FY2025 operating income. Not a bargain, not a bubble. A price that leaves room for a few months of execution and none for an air pocket.
The reaction to earnings is where the caution shows up. Carvana’s average post-earnings move is 11.5%, and the last four moves went +17.0%, -13.8%, -7.9% and -7.4%, against reported revenue growth of 52% to 58% every quarter. Three straight declines on quarters that grew by more than half is a market that wanted more. I read that as the stock being priced above the numbers it actually got, not as a verdict on the business.
Gross margin also slipped slightly, from 21.0% in FY2024 to 20.6% in FY2025. It is 40 basis points, small against a year of 49% growth, but it is the first step down since the recovery began. If it continues, the operating margin will lag the revenue story.
Short interest is 9.2% of the float, with 7.3 days to cover as of the end of August. That is high enough to amplify a move in either direction. The quantitative grade from our model moved from C to D in recent weeks, a downgrade in the model that says nothing about the recovery itself and a lot about how the stock has traded.
Where the comparison to other margin stories helps
A company can go from crisis to profit and still not be a bargain. The useful comparison is with a turnaround story where the margin question was whether the worst was behind it, like UnitedHealth’s margin crisis. In that case the debate was about a margin falling. Here it is the reverse: a margin that rose from negative 11% to positive 9%, and the debate is about whether the endpoint holds. The two make a good pair because they test the same variable from opposite directions.
I would also point readers to how I pick stocks, because Carvana is a good case for the rule on valuation I lean on: a great recovery is a fact about the past, and the price is a claim about the future. The stock can be right on the first and wrong on the second.
What I am not covering
This piece does not model unit economics, used-car pricing, financing arrangements or debt. Our data shows a single reporting segment for the June quarter, so there is nothing to break out by business line. Liquidity and interest costs matter for a company that nearly failed, but I have no debt figures in the facts I use, and I would rather leave the topic out than guess.
A framework for the next six months
The debate reduces to two numbers. First, whether FY2026 operating margin holds near 9.3% while revenue grows at 40% or better. If it does, a forward multiple around 40.9 will look reasonable in hindsight, because earnings would then be growing faster than the consensus figure suggests. If the margin slips below 7%, which is where it stood in FY2024, the trailing P/E of 34.4 loses its support and the price-to-sales premium of four times the industry would be hard to defend.
Second, the gross margin. It reached 21.0% in FY2024 and slipped to 20.6% in FY2025. Every 100 basis points on $29.5 billion of annualized revenue is about $295 million of gross profit. That is roughly 16% of last year’s operating income, so a small slip in that line moves the whole result.
The revenue line that decides the multiple
I would hold Carvana to one test. Growth of 40% on FY2025 revenue of $20.3 billion would put FY2026 revenue near $28 billion. If the gross margin stays above 20% and the operating margin does not drop below 9%, that is about $2.5 billion of operating income, which would cut the multiple on today’s market value to roughly 19. Below either threshold, the argument for calling it cheap gets thin. Above both, it does.
Financial disclaimer: The content on StockVane is for educational and informational purposes only and should not be construed as professional financial advice. Stock market investing involves risk of loss.
Sources: Price-to-earnings ratio (SEC Investor.gov glossary) (https://www.investor.gov/introduction-investing/investing-basics/glossary/price-earnings-pe-ratio) · Market capitalization (SEC Investor.gov glossary) (https://www.investor.gov/introduction-investing/investing-basics/glossary/market-capitalization)