
What does $78 billion buy? At Ferrari’s current market value of $78.3 billion, it buys $2.10 billion of annual operating income, which works out to about 37 times. A mainstream automaker fetches a small fraction of that. The question I want to settle is whether scarcity, the thing everybody points to, actually shows up in Ferrari’s reported numbers, or whether it is a story we tell about the multiple after the fact.
My read is that the numbers support scarcity in one place and leave a gap in another. The place they support it is profit per extra dollar of sales: each year Ferrari has kept more of its incremental revenue than any car company should. The gap is that our data holds no unit shipments, so I can show the result of restraint but not the restraint itself. Readers should hold both facts at once.
The multiple on the screen
Ferrari trades at 39.4 times trailing earnings of $10.32 a share and 38.3 times forward earnings of $10.62. The five-year average P/E is 38.8, so the stock sits almost exactly where it has spent the last five years, at the 44th percentile of a band that ran from 21.1 to 56.5. The valuation tab carries the chart.
Price to sales is the cleaner tell. Ferrari trades at 9.4 times sales, above its own five-year average of 8.2 and far above the industry figure of 1.7. That gap is where the scarcity claim lives. Investors are paying about five and a half times the sector multiple for each dollar of revenue, and they only do that when they believe the revenue is unusually durable and unusually profitable.
One data quirk needs a caveat. Our data lists an industry average P/E of 52.4, higher than Ferrari’s own. I would not lean on that average. It is a mean across a small group, and a handful of very high multiples in any small group will drag it up. The price-to-sales comparison holds up better because it does not depend on a few loss-recovering names.
A comparison from the grocery aisle helps here: Costco at 50 times earnings is the same argument about paying for durability. Book value tells the same story in another accent: 17.1 times against a five-year average of 16.1 and an industry average of 3.3.
Growth slowing, margin rising
Revenue growth has decelerated every year since FY2021: 23%, 19%, 17%, 12%, then 7% in 2025. Revenue rose from $4.27 billion to $7.1 billion over that stretch, a cumulative gain of 67%. A company selling on volume would be embarrassed by that slope.
Operating income went the other way. It rose from $1.07 billion in FY2021 to $2.10 billion in FY2025, a gain of 96%, nearly double the revenue increase. EBIT margin in our data went from 25.3% to 24.2% in FY2022, then 27.3%, 28.9% and 29.5%. Operating income divided by revenue gives 29% for FY2025, a match within rounding, so I cite either figure without conflict.
The clearest way to see this is incremental margin: the share of each new dollar of revenue that lands as operating income. FY2022 was the soft year at 18%. Then FY2023 came in at 45%, FY2024 at 38%, and FY2025 at 47%. Each of those three is well above the average margin of the year before. A company that earns 29 cents on the average dollar and 47 cents on the extra one is not building more of a low-margin product.
I read that as pricing power and mix. Our data cannot separate them from volume, and I will not pretend it can.
| Metric | Value | Context |
|---|---|---|
| Price (approx.) | $406.69 | 52-week range $309 to $499 |
| P/E (TTM) | 39.4x | Five-year average 38.8x |
| Price-to-sales | 9.4x | Five-year average 8.2x |
| Analyst ratings | 93% buy, 7% hold | 14 analysts; average target $467 |
| Dividend yield | 1.02% |
What our data cannot show
The title makes a claim about production restraint. Shipments, order books and waiting lists are not in the data I use, so I cannot measure them. What I can measure is the financial footprint: revenue up 67% over four years alongside operating income up 96%, and gross margin of 51.7% against 50.1% the year before.
Gross margin is worth a closer look. It was 51.3% in FY2021, dipped to 48.0% in FY2022, and recovered to 51.7% in FY2025. A gross margin above 50% is not a typical car-maker number. That is the whole case in one figure, and it is measured, not asserted.
There is a competing explanation I take seriously. Margins can rise for reasons that have nothing to do with scarcity, such as currency, a favorable product cycle, or cost cuts. If the increase came from one-off tailwinds, the margin would fall back when the tailwind fades. The five-year trend argues against that, since the margin has risen in four of five years, but a single year of decline would reopen the question.
The earnings and the return
Net income reached $1.6 billion in FY2025, up 5% from $1.5 billion, and diluted EPS was $9.01, up 6%. That is the slowest earnings growth in the five-year table, after 37%, 13%, 36% and 23%. Trailing EPS of $10.32 is above the fiscal-year figure, which says the last four quarters have earned more than the fiscal year did.
Forward EPS of $10.62 implies growth of 3%. That is low for a stock at 38.3 times. To pay that multiple and earn a market-like return, you need EPS growth to run well above 3%. Put differently, the stock has to rely on growth that consensus does not currently forecast, or on the multiple staying where it is. Neither is a comfortable assumption.
The dividend is small: $4.13 a share over the last twelve months, a yield of 1.02%. This is not an income holding, and I would not treat it as one.
Where the crowd stands
Fourteen analysts cover it, 93% rate it a buy, and the average target is $467, 15% above the $407 price. The high target of $562 implies 38%, and the low target of $398 sits -2% from the current price, so the lowest analyst is roughly at the market. Consensus is comfortable, and that on its own is a reason for caution when the stock is 18.5% below its high of $499 and 32% above its low of $309.
The earnings-day record is moderate. The average move after a report is 4.3%. The last three: +8.1% in February, -4.0% in May, and +3.1% on 2026-07-30. That is a stock that reacts, but not violently. Short interest is only 1.8% of the float, so this is not a crowded-short setup either. The model grade we track moved from C to D in the last week, a signal I do not read as a comment on the business.
How it compares with other premium multiples
Ferrari is not the only company where the multiple, not the product, is the question. The same puzzle appears in Walmart trading like a software company frames the same trade-off for a retailer, and on this site it is a useful contrast with a luxury name. The link between them is that each investor is paying today for a decade of stable economics.
There is a further parallel with Exxon, where the argument is discipline rather than the oil price. Restraint is what both sets of investors are buying, and in Ferrari’s case that restraint is exactly the part my data cannot measure.
Reading the two sides together
The bull reading is simple. Growth is slowing to 7% yet operating income still grew 12% in FY2025, so the business converts each dollar better each year. A stock priced at 9.4 times sales is a bet that this conversion continues. The bear reading is just as simple. Revenue growth has fallen by more than two-thirds in four years, from 23% to 7%, and no pricing strategy can lower that number forever without eventually hitting demand. At some point the margin has to stop rising, and the multiple has to explain itself with earnings growth of 6%, not 30%.
I lean toward the bull reading on the business, in the way ASML is a very good business that is hard to time, and the bear reading on the price. Those are compatible views, and they explain why the multiple has not moved far from its five-year average: the market agrees the quality is real and has not decided the price is a gift.
What I am not covering
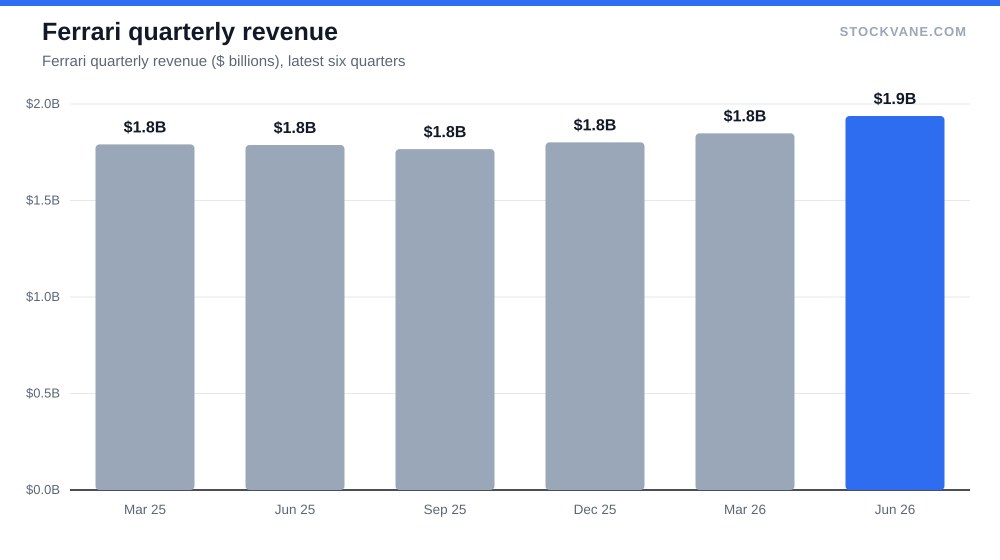
I am not covering racing, brand licensing or the order book, none of which I can measure here. Our data shows a single segment for the June quarter, $1.9 billion of revenue, up 8% on the year and 5% on the prior quarter, so there is nothing to split by product. Currency is also outside the numbers I use.
Where scarcity shows up first
If scarcity is real, it will show in the margin before it shows in the price. So the test is simple. Operating margin has to stay at or above 29% on revenue growth of 7% or more; that keeps the FY2025 pattern intact, and the multiple of 38.3 has an argument. If revenue growth falls to the low single digits and the margin stops rising, then the stock is being valued on a story the reported numbers no longer confirm, and I would want the P/E back near the five-year low of 21, or at least well under 30, before calling it a fair price.
Gavin Thorne has invested in U.S. stocks for six years and previously worked at a large publicly traded internet company. He writes about income-oriented strategies, including cash-secured puts, and about how he reads company data. This article reflects his personal research process and is for informational purposes only. It does not constitute investment advice.
Sources: Dividends (SEC Investor.gov glossary) (https://www.investor.gov/introduction-investing/investing-basics/glossary/dividend) · Dividends tax topic (IRS) (https://www.irs.gov/taxtopics/tc404)