
For two years the AMD debate has gone the same way. Management shows a data center roadmap that reads well next to Nvidia’s, the stock moves on the promise, and somebody points out that the revenue has not caught up. In August the revenue caught up a good deal of the way.
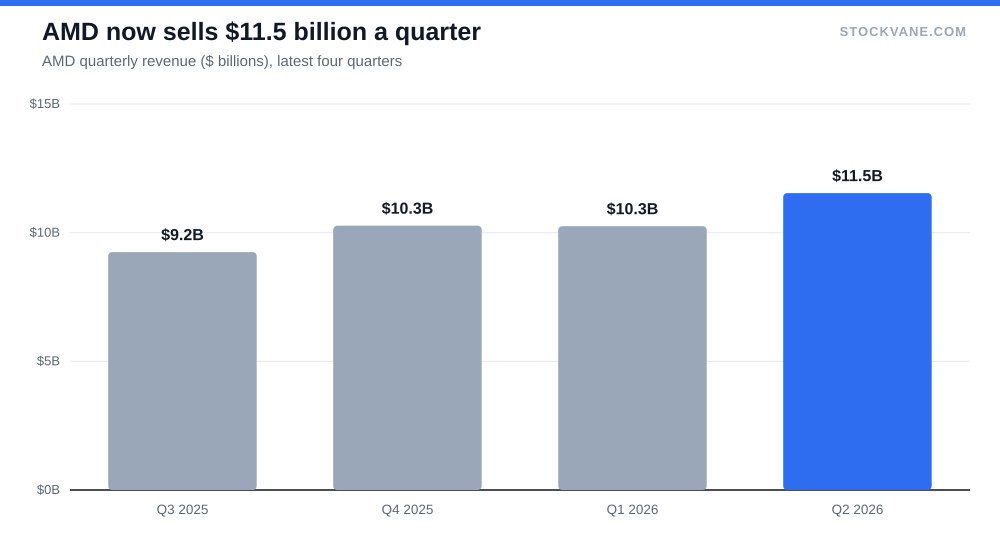
Second-quarter revenue was $11.5 billion, up 50% from a year earlier, and net income was $2.3 billion, up 163%. Data center sales now make up 58% of the company. If you spent the last two years waiting for proof, this is what proof looks like.
The problem is that the price got there first. At about $560 a share, AMD trades near 144 times trailing earnings, and the argument has moved from whether the growth is real to whether 144 times is a sane price for it.
What the revenue line now says
The financials tab tells a clear story. Revenue fell 4% in 2023 to $22.7 billion during the chip inventory correction, then grew 14% in 2024 and 34% in 2025 to $34.6 billion. Since the end of last year growth has sped up: 34% in the fourth quarter, 38% in the first quarter of this year, and now 50%.
Profitability moved in the same direction. Gross margin rose from 44.5% in 2020 to 49.5% in 2025, and the operating margin climbed from 2.6% in 2023 to 12.3% in 2025. Revenue was not simply getting bigger; each dollar of it was earning more.
The mix is what changed the company. Data Center brought in $6.7 billion last quarter, Client and Gaming $3.8 billion and Embedded $1.0 billion. A business that used to be defined by PC processors is now defined by AI accelerators and server chips, and any valuation from two years ago is describing a different company.
Earnings caught up, but not to the price
Trailing net income over the last four quarters is about $6.4 billion. A year earlier the same measure was $2.8 billion, so profit rose roughly 2.3-fold. Net margin on the trailing numbers is about 15.6%, up from 12.5% for full-year 2025. The company is getting bigger and keeping more of it, which is exactly what the bulls wanted.
Now compare that with the share price, which is 3.6 times its 52-week low of $155. Over roughly the same year, profit rose 2.3-fold and the stock rose 3.6-fold. The gap between those two numbers is the multiple expanding. That is not an accusation. Markets pay more for a business once its growth becomes visible. But it means some of the good news has already been collected by people who bought earlier.
The multiple, in plain numbers
On the valuation tab, AMD’s trailing P/E of 144 compares with a five-year average of about 51. The price-to-sales ratio is 20, about twice its five-year average of 10 and near the 96th percentile of its own range. The forward P/E, which assumes earnings keep growing, is about 59.
For comparison, Nvidia, the company AMD is chasing, trades at roughly 28 times trailing earnings. I went through Nvidia’s own numbers in the Nvidia forecast. AMD is about a sixth of Nvidia’s market value and trades at five times its trailing multiple. The premium exists because AMD is smaller, growing from a lower base, and the market is paying for share it has not yet won.
What has to be true
I find it easier to judge a multiple by asking what the business must become to justify it. The grid below holds the price at $560 and the share count near 1.63 billion, then asks what P/E the stock would carry at different levels of annual revenue and net margin.
| Annual revenue | At 15% net margin | At 20% net margin | At 25% net margin |
|---|---|---|---|
| $60 billion | 102x | 76x | 61x |
| $80 billion | 76x | 57x | 46x |
| $100 billion | 61x | 46x | 37x |
Trailing revenue is $41 billion, so the first row of the grid, $60 billion, is about 45% above what the company sells today. Even at a 20% net margin that leaves the stock at 76 times earnings. To get into the 40s you need $80 to $100 billion of revenue and a net margin of 20% to 25%, which means roughly double to two and a half times today’s sales at a margin well above the 12.5% the company earned in 2025.
Try a gentler version. Suppose revenue grows 40% over the next year, to about $58 billion, and the net margin holds at 20%. That produces earnings near $7.10 a share, and the stock would still trade at about 79 times them. The story can go right and the multiple can still stay high.
I am not saying that cannot happen. Growth like the last quarter’s, sustained for two or three more years, gets you close. I cannot say how fast this compounds, and nothing in the data says 50% is a ceiling. But it is worth knowing that the current price already sits in the optimistic half of the grid.
What the analysts are doing
The analyst consensus looks enthusiastic on the surface. Of 33 analysts, 85% rate the stock a buy and none rate it a sell. Then you look at the targets. The average of $654 is only about 17% above the current price, and the lowest target, $540, is already below it.
The most recent reiterations tell the same story. In mid-September the news feed shows Piper Sandler holding a Buy with a $600 target and Truist a Buy with $594, roughly 6% to 7% above the price. Analysts still like the company. They are not promising much from here.
The run rate is a better yardstick
Trailing numbers understate a company that is growing this fast, so I also look at the latest quarter on its own. Net income in the second quarter was $2.3 billion on $11.5 billion of revenue, a net margin of 19.9%. That is almost exactly the middle column of the grid above. Multiply the quarter by four and you get about $46 billion of revenue and $9.2 billion of profit, or roughly $5.60 a share.
At today’s price that is about 99 times the run rate. It is a far friendlier number than 143 times trailing earnings, and it still asks for a lot. Notice what it assumes: no slowdown, no margin slip, and another year of growth on top before the multiple looks ordinary.
How the gap to Nvidia looks
It is tempting to say AMD is cheap next to the growth it is showing, and next to its own history it may be. Next to Nvidia it is not. Nvidia trades at about 28 times trailing earnings and about 18 times forward earnings. AMD trades at 144 and 59. An investor who wants exposure to the AI chip cycle can pay about 28 times for the market leader or 144 times for the challenger.
That does not make Nvidia the better buy on its own. The two companies are at different stages, and challengers can grow much faster from a small base. But it does mean the price of being wrong is higher with AMD, because so much of the future is already in the stock.
Earnings days have been violent
If you own AMD, expect the reports to hurt sometimes. The stock fell 17.3% the day after its report in February, rose 18.6% after the one in May and fell 7.0% after the one in August. The November report before that produced a gain of 2.5%. The average move across those four reports was about 11% in one direction or the other. I will not guess why any of them happened, because the data does not say. It does show that a stock priced this richly moves hard in both directions on new information.
Short interest is about 2.6% of the float, low enough that nobody is betting heavily against the story. In mid-September the news feed also carried a report that a company officer sold about $48 million of stock. Insider sales have many innocent explanations, so I would not build a thesis on one. It adds a small data point to a picture that is already mixed.
The number that would settle it
The number I would watch is quarterly revenue growth. Growth accelerated from 34% to 38% to 50% over the last three quarters. If it stays above 40% for two more quarters, the top half of the grid starts to look reachable and the multiple can hold. If it slips back toward 30%, a stock at 144 times earnings has very little to fall back on.
If you already own it, the sensible question is size, not direction. A holding that can move 17% in a day on a report belongs in the part of a portfolio that can take it, and a position you would have to sell after a bad day was too big before the day started. If you do not own it, waiting costs you little in income, since the stock pays no dividend.
My view is that AMD has earned the credit it is getting for the business and is getting a little too much for the price. I would keep it on a watch list and would want a better entry, closer to the middle of that grid than the corner. The revenue is finally doing what the roadmap slides promised. That does not make every price a good one.
Financial disclaimer: The content on StockVane is for educational and informational purposes only and should not be construed as professional financial advice. Stock market investing involves risk of loss.
Sources: Dividends (SEC Investor.gov glossary) (https://www.investor.gov/introduction-investing/investing-basics/glossary/dividend) · Dividends tax topic (IRS) (https://www.irs.gov/taxtopics/tc404)