
Arm keeps 97.5 cents of every revenue dollar after direct costs. Only 18.5 cents survive to operating profit. The 79 points in between are the most useful thing to understand about this company, because they show what Arm actually is: a very small factory for intellectual property attached to a very large engineering payroll.
Arm licenses processor designs and collects royalties when its customers ship chips built on them. It makes no silicon itself. That keeps direct costs close to nothing, and it also means the stock’s price, $275.61 in our latest snapshot, has to be defended by revenue growth alone. The thesis, then, is narrow. Arm’s revenue is unusually steady and its gross margin is close to the ceiling, so the growth is real; but at 281 times trailing earnings the stock already assumes several more years of it, and the data give me no room to call that price cheap.
Where 79 points of margin go
Look at the financials tab and the shape of the income statement is unusual. Gross margin was 97.5% in fiscal 2026 (the year ended March), up from 92.9% in fiscal 2021. Operating margin was 18.5%, down from 25.2% in fiscal 2022 and a thin 3.6% in fiscal 2024.
The gap is mostly research and development. R&D was $2.78 billion in fiscal 2026, 56% of revenue and up 34% from the year before; in fiscal 2022 it was $995 million. Roughly 23 more points sit in other operating costs that this data set does not break out.
I read the R&D line as the real price of staying relevant. Arm has to design the next generation of cores years before a customer commits to one, and that work is paid for whether or not the chip ships. Each extra dollar of royalty would fall almost entirely to profit if spending stood still. It hasn’t. Fiscal 2026 shows the same squeeze in miniature. Revenue grew 23%, R&D grew 34%, and operating profit rose only from $0.83 billion to $0.91 billion. Net profit grew 14%, well behind sales. A royalty business is supposed to turn each new sales dollar into outsized profit, and this year it did not. Fiscal 2024 is the warning. Revenue rose 21% that year, to $3.23 billion, and net profit fell 42% to $0.31 billion. Costs jumped ahead of sales, and it took a year to catch up. Net profit rebounded to $0.79 billion in fiscal 2025 and reached $0.90 billion in fiscal 2026, an 18% net margin.
Revenue that rarely stumbles
Revenue has grown 21%, 24% and 23% in the last three fiscal years, to $4.92 billion, from $2.03 billion in fiscal 2021. That is a narrow band for a semiconductor-linked business. The one break in the record is fiscal 2023, when sales slipped 1%.
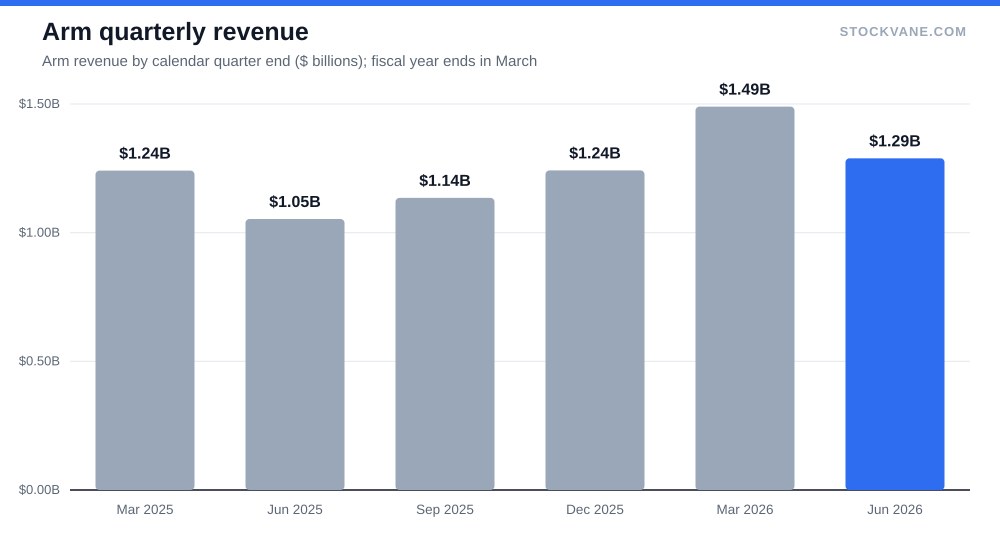
The quarters carry a seasonal pattern that is easy to misread. Revenue for the June quarter was $1.29 billion, down 13% from the $1.49 billion of the March quarter. A year earlier the same step was down 15%. Against the June quarter of 2025, the latest one grew 22%. Read the year-over-year figure, not the sequential one.
Quarterly net profit over the last four reported quarters adds up to about $1.04 billion. It swings more than revenue does: $0.31 billion in the March quarter, $0.27 billion in June, and I cannot tell from this data what drives the swings.
Put the two together and the picture is steady on the top line and lumpy underneath. I would take that trade in most years, since revenue is the harder number to fake and the slower one to reverse. But it also means the growth rate alone will not carry earnings. The cost line has to cooperate.
One thing the data cannot do is split royalties from license fees. Arm reports a single segment, so I cannot say how much of the growth comes from more chips shipping and how much from a higher royalty per chip. That distinction is the center of the bull case, and I am not going to pretend to measure it. Trailing earnings work out to about $0.98 a share. The valuation tab shows a P/E of 243.9 on its own basis against a five-year average of 359.3, which sounds like a discount. It is not one. Earnings collapsed in fiscal 2024, which pushed the historical multiple to absurd heights and dragged the average up with it.
What 281 times earnings asks for
The forward P/E is 176.4, which implies about $1.56 of earnings over the next year, roughly 59% above the trailing figure. The semiconductor industry average on that page is 30.6. Apply that multiple to the forward earnings and you get about $48 a share, against $275.61 today.
Put in dollars, the market value is about $294 billion against roughly $1.04 billion of net profit over the last four quarters. That is 282 years of current earnings, or a company that has to grow its profit several times over before the price looks ordinary. Some businesses do that. Most do not do it on a schedule.
Price to sales says the same: 49.5 against 13.4 for the industry.
| Forward EPS Multiple | 40x earnings | 70x earnings | 100x earnings |
|---|---|---|---|
| $1.56 a share | $62 | $109 | $156 |
| $2.50 a share | $100 | $175 | $250 |
| $4.00 a share | $160 | $280 | $400 |
The grid is arithmetic, not a forecast. To justify today’s price at 100 times earnings, Arm would need about $2.76 a share, 2.8 times the trailing figure. At 60 times it would need $4.59, which is 4.7 times. Growth of 20% a year in revenue does not produce that on its own. It needs margins to widen, and the R&D history says that is the hard part.
The shares have not been a calm ride while this argument plays out. They closed June at $355 and July at $240, a 32% fall in a month, and they now sit 39% below the 52-week high of $452.70 while still 176% above the low of $100.02. Earnings days have been equally rough: the last six reports moved the stock +7.4%, -10.1%, +5.7%, -1.2%, -13.4% and -6.2%, an average swing of about 7.3%.
Twenty analysts, one modest gap
Of the 20 analysts on the analysts tab, 85% rate Arm a buy and none a sell. The average target of $315 sits 14% above the price, and the range is wide, from $230 (17% below) to $500 (81% above). A cluster of buy ratings alongside a low target that is under the current price tells me the bulls are arguing about how big the multiple can get, not whether the business is sound. Our quant rating agrees with the message, if more cautiously. It moved from a C with a score of 57 on September 8 to a B with 88 in the latest reading. That is a strong improvement in two weeks, though I would not lean on it, since quant scores respond quickly to price moves and this one has had plenty.
| Metric | Value | Context |
|---|---|---|
| Price (approx.) | $275.61 | 52-week range $100 to $453 |
| P/E (TTM) | 281.2x | Five-year average 359.3x |
| Price-to-sales | 49.5x | Five-year average 38.4x |
| Analyst ratings | 85% buy, 15% hold | 20 analysts; average target $315 |
Short interest is small: 1.6% of float, about 4.4 days to cover. Nobody is betting hard against the multiple. That removes one route to a squeeze and one to a forced sell-off, which fits a stock whose risk is valuation rather than positioning, and it means a decline would have to come from holders deciding on their own that the price is too high.
What could break the case
A fair counter-case starts from the bulls’ own best evidence. Sales have compounded at more than 20% for three straight years, the gross margin has crept up every year since fiscal 2021, and the quant score improved. If Arm merely repeats that for two more years, the forward earnings estimate of $1.56 could prove low, and my $48 industry-multiple figure would then be too harsh. I hold that view loosely, because a 176 times multiple rewards exactly the kind of upside surprise I cannot rule out.
The most direct threat is one I cannot see in this data: customers that design more of their own cores, or that pay less per chip than Arm expects. A royalty model is only as durable as the alternatives are unattractive. Recent headlines in the news flow describe Arm reaching into x86-dominated data-center territory, which is the growth story, and also a fight with much larger incumbents.
The second is cost. If R&D keeps rising 30% or more a year while revenue grows 20%, operating margin drifts lower from 18.5%, and a growth stock priced at 176 times forward earnings cannot absorb that. The third is simply the multiple. If the market settles on 60 or 70 times earnings for a business growing this fast, the shares fall well below today’s price even when everything goes right.
I am not covering the smartphone cycle. Unit data is not in my tables.
The quarter that would tighten the case
The next report is the test I would circle. The June quarter a year earlier came in at $1.24 billion, so 20% growth means about $1.49 billion for the September quarter. Below that, I would read the growth band as breaking. Above it, with R&D growing slower than revenue and operating margin back above 20%, the multiple starts to look like something earnings can catch up to. Until then, 276 is a price for the outcome, and I would want the evidence first.
Financial disclaimer: The content on StockVane is for educational and informational purposes only and should not be construed as professional financial advice. Stock market investing involves risk of loss.
Sources: Price-to-earnings ratio (SEC Investor.gov glossary) (https://www.investor.gov/introduction-investing/investing-basics/glossary/price-earnings-pe-ratio) · Earnings reports (SEC Investor.gov glossary) (https://www.investor.gov/introduction-investing/investing-basics/glossary/earnings-report)