
On February 21, 2020, six large REITs, held in equal dollar amounts, were worth their full price. By March 23 the basket had fallen 37%. A landlord who owned a duplex over the same stretch would have received rent, paid the mortgage, and heard nothing about the value of the building until someone asked. No ticker, no red number, no story.
That gap in reporting is the real difference between a REIT ETF and a rental property, and it is the one most comparisons get backwards. My argument is that the volatility gap between the two is mostly a gap in how often the price gets written down. What separates them in earnest is control, borrowing and what you can do when the price falls, and each of those cuts differently for different owners.
One caution about the data before going further. StockVane’s database holds no REIT fund and no direct property, so I cannot show you an ETF’s price history. Instead I used six large REITs from the 300-stock coverage list, American Tower, Digital Realty, Equinix, Prologis, Simon Property and Welltower, and bought them in equal dollar amounts on January 2, 2020. A REIT ETF is a weighted basket of names like these, so the pattern should carry over, but the exact percentages belong to this six-stock basket and not to any particular fund. The price series runs to September 18, 2026: 1,682 trading days, price only, no dividends.
What the basket did
Over the whole period the basket gained 103% in price, and it did so in a jagged line. The calendar-year path shows how jagged.
Read the middle of that chart first. After a 45% year in 2021, the basket lost 28% in 2022, when interest rates rose fast (our note on the September 16 Fed hike covers where that cycle stands now). Its low came on October 12, 2022, when it stood 39% below its prior peak. That is a fall of roughly two-fifths, and it took most of 2023 and 2024 to climb back.
Now compare that to what an owner of a single rental building saw in 2022. Rents were mostly rising. The mortgage payment on a fixed-rate loan did not change. The monthly statement looked normal. Whether the building was worth 39% less is a fair question, but nobody asked it until the owner tried to sell or refinance.
Annualized volatility of the daily price moves in the basket was 24.5% over the whole span. Three of the six sit near 30%, with Prologis at 30%, American Tower at 30% and Digital Realty at 31%. The two ends are wider. Welltower came in at 37% and Simon Property at 44%.
| REIT | Annualized volatility | Worst peak-to-trough | Price change since Jan 2, 2020 | Distance from 52-week high |
|---|---|---|---|---|
| American Tower (AMT) | 30% | -45% | -8% | -10.4% |
| Digital Realty (DLR) | 31% | -49% | +93% | -11.6% |
| Equinix (EQIX) | 30% | -42% | +100% | -8.7% |
| Prologis (PLD) | 30% | -43% | +83% | -11.4% |
| Simon Property (SPG) | 44% | -71% | +104% | -13.0% |
| Welltower (WELL) | 37% | -63% | +243% | -10.0% |
| Equal-weight basket | 24.5% | -39% | +103% | n/a |
A rate-sensitive income stock from outside real estate makes a useful cross-check on how much of this is about rates, and we looked at one in our NextEra piece. The point is not that utilities and REITs are twins. The point is that both are priced off the same long-term borrowing costs, and both get repriced every second the market is open.
The mall owner and the tower owner are not the same asset
Simon Property is the cautionary line in the table. Its shares fell 71% from peak to trough at some point since January 2020, yet today they trade only 13% below their 52-week high and are up 104% in price since the start of 2020. The stock recovered. A person who owned a mall directly through the same period would have had to find a way to hold on, and that depends on lenders, not on price charts.
American Tower is the opposite case. It lost 8% in price over the full stretch, even though its volatility of 30% is no higher than Prologis. A dull path can still end up flat for six years. That matters for the comparison because the “steady” reputation of real estate is often a statement about how a private asset is reported, and not about how much the owner earned.
At the other end sits Welltower. A $10,000 stake in the stock at the start of 2020 would be worth roughly $34,000 in price terms today, a 243% gain, even after a 63% drop along the way. Its market value is about $165 billion and its trailing P/E is 105, with a dividend yield of 1.29%. Those are numbers you would expect from a growth stock, not from a landlord. A price that has run this far no longer describes a bond-like income stream, and any buyer of a REIT ETF holding it is paying for growth expectations that a rental duplex cannot offer.
Why the property looks calmer
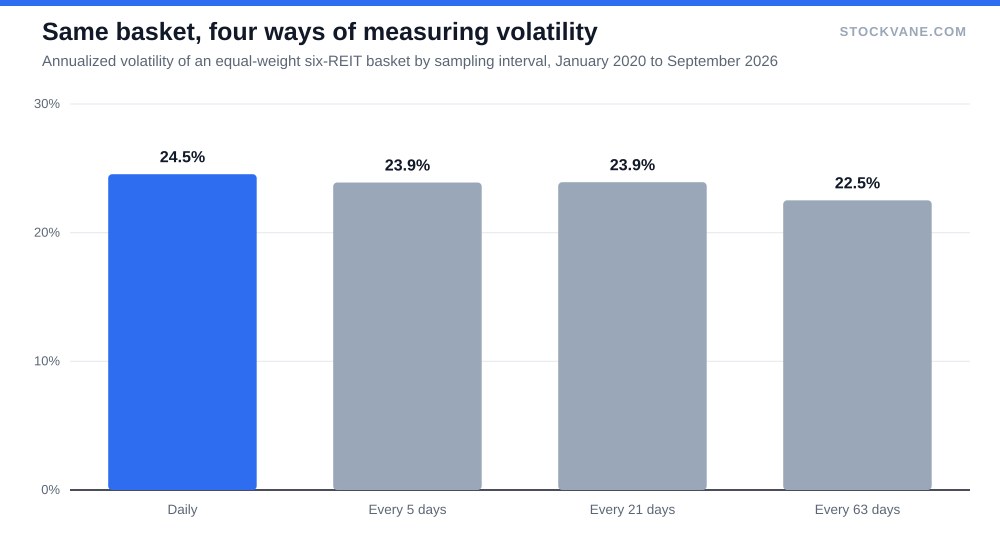
Sample the basket less often and its volatility barely moves. Measured daily, it is 24.5%. Measured every five trading days, 23.9%. Every 21 days, 23.9%. Every 63 days, about one quarter, 22.5%.
That result surprised me. If quarterly reporting alone made a property look calm, the quarterly figure would be far below the daily one. It is only two points lower. Checking the price less often does not hide much of the risk.
What does hide it is smoothing. An appraisal usually leans on the last few comparable sales and on the previous appraisal, so it moves slowly toward a new price and lags the market by months. A bank valuation or an owner’s own estimate does the same. I read that as the main reason private real estate looks so steady in published return series: the number is an average of the past, not a fresh bid. This is an inference from how appraisals work, since the database has no appraisal data to test it.
The counter-case is fair, and it is the one I would press hardest on my own argument, and I would not wave it away. A physical property really is a different asset from a REIT share. It has one location, one tenant mix, and often one mortgage, so its true risk can be higher than a diversified basket’s. Smoothing flatters the reported figure, and concentration worsens the real one. Both are true at once.
Concentration deserves its own paragraph. Each name in the basket, such as Prologis with its warehouses, owns thousands of sites or hundreds of properties, and the six together span towers, data centers, warehouses, malls and senior housing. One building has one street, one roof and one set of tenants. When a REIT loses a tenant, it is a rounding error in a rent roll; when a landlord loses the only tenant, the income stops that month. I would expect the true year-to-year risk of a single property to sit above the basket’s, though the database cannot measure it.
What each structure lets you do
Borrowing is where the two diverge most. A REIT already carries its own borrowing inside the company, and the ETF holder adds none by default. A landlord can put 20% or 25% down and borrow the rest, which multiplies every move in the building’s price. As a hypothetical, with $100,000 down on a $400,000 building, a 10% fall in market value is a $40,000 loss, or 40% of the owner’s cash, while the same 10% fall costs an unlevered ETF holder 10%. The loan payment does not shrink when the price falls.
Then there is the exit. A REIT share sells in seconds at a visible price, in whatever size a retail account can hold. A building takes months, costs a broker’s commission and closing fees, and requires a buyer who will accept your price. The price you get on the way out is the one honest measurement of a property’s value, and by then the decision has been made.
Two things go to the direct owner’s account, and I do not want to bury them. Control over rent, upkeep and timing is real, and so is the ability to add value by renovating, which no ETF holder can do. I have not tried to price that here because the database says nothing about it. Weigh it separately, and weigh it honestly: for many owners the ability to fix a roof or raise rents is the whole reason to buy a building.
Rates tie the two together. The 2022 drawdown in the basket coincided with the sharpest rise in borrowing costs in the period, and the same rise hit the buyer of every building. The direct owner just never saw it marked.
A test I would run on any property quote
Ask for the building’s value marked the way the ETF is marked, at the worst point of the last cycle. For this basket that point is 39% below the prior peak, and 37% in the single month ending March 23, 2020. If the answer is that the property was never priced during that period, then the volatility comparison you are looking at compares a measured number to an unmeasured one.
The figure I would hold a direct-ownership pitch to is simple: the equity left after a 30% fall in value. At 25% down, a 30% fall leaves nothing for the owner. If that outcome is unacceptable, the ETF is the cheaper way to hold the same exposure, even though its price will look worse every day.
Financial disclaimer: The content on StockVane is for educational and informational purposes only and should not be construed as professional financial advice. Stock market investing involves risk of loss.
Sources: Dividends (SEC Investor.gov glossary) (https://www.investor.gov/introduction-investing/investing-basics/glossary/dividend) · Dividends tax topic (IRS) (https://www.irs.gov/taxtopics/tc404)