
The 1099s arrive in January. The Schedule K-1 from a partnership like Energy Transfer arrives in March, sometimes later. It is the reason a lot of tax returns get extended. That small calendar difference is the first thing a 6.3% yield leaves out.
It is not the most important thing, though, and this piece makes that case with numbers. The K-1 costs roughly the same for every holder, so it is a rounding error on a $50,000 position and a large bite of income on a $5,000 one. The bigger question is whether the distribution is covered. In fiscal 2025 Energy Transfer’s free cash flow covered 0.81x of the cash it paid to unit holders, down from 1.59x a year earlier. The payout has risen every quarter anyway. My view is that the paperwork is a fixed price you can plan for, and the coverage gap is the variable you cannot.
What arrives in March
Energy Transfer is a master limited partnership, so you own units and not shares. The partnership itself pays no corporate income tax. Instead it passes your share of income, deductions and credits to you on a K-1, and you report them on your own return. A K-1 rarely matches the cash you received.
Most of each cash distribution is typically treated as a return of capital and not as income in the year you receive it. That lowers your cost basis. Suppose you bought 1,000 units at about $21.14, a cost of $21,140. The trailing distribution is $1.335 a unit, so you would collect roughly $1,335 a year. In the extreme case where every dollar is a return of capital, five years of distributions would reduce your basis to about $14,465. The tax is deferred, not forgiven. When you sell, the gap between the sale price and that lower basis is taxable, and part of it can be taxed as ordinary income under the depreciation recapture rules.
I do not know Energy Transfer’s actual split for any year, and it changes annually. It is printed on the K-1 and on the company’s investor relations page. Two other points a preparer would raise: a partnership operating in many states can create state filing obligations for its holders, and units held inside an IRA can trigger a tax on unrelated business income above $1,000 a year. Neither is a reason to avoid the name. Both are reasons to ask a tax professional before you buy, not after the form shows up.
What the paperwork costs, by position size
The direct cost is a preparer’s extra fee or your own extra hours. I have no way of knowing what yours is, so the table uses $150 a year as an assumption. Change it to suit your situation, the pattern holds either way.
| Position size | Annual distributions | Extra cost as share of income | Yield after $150 fee |
|---|---|---|---|
| $5,000 | $316 | 48% | 3.32% |
| $10,000 | $632 | 24% | 4.82% |
| $25,000 | $1,579 | 10% | 5.72% |
| $50,000 | $3,158 | 5% | 6.02% |
The ratio is what matters here: the same $150 takes 48% of the income from a $5,000 position and 5% from a $50,000 one. At $5,000 the headline 6.32% yield becomes about 3.3% after the fee, which a plain dividend stock with a 1099 can match. Small holders should be the ones weighing the K-1 most carefully, and I suspect many buyers who see “6% yield” on a screen do not.
There is a partial offset that I would ask about but not count on. Many MLP holders qualify for a deduction on qualified business income, which can lower the tax on the taxable portion. Eligibility depends on your income and return, so I treat it as a question for a preparer and not as a feature of the yield.
The payout goes up by a quarter of a cent
Over the last four payments, the quarterly distribution rose from 33.25 cents to 33.50, 33.75, and then 34.00 cents per unit, with the latest ex-dividend date on August 7. That is a gain of 2.3% in three quarters. Annualized, the current rate is $1.36 a unit, or 6.43% at today’s price.
Small, steady increases are healthier than one big jump that later needs walking back. The record here shows why that matters. Fiscal 2020’s distribution was $1.07 a unit. Fiscal 2021’s was $0.61, roughly a 43% cut. It then climbed back to $0.87 in 2022 and higher since. So the current run of raises follows a reset, and a high yield in this name has meant a reduced payout before. I do not read that as a prediction, only as evidence that this payout is a decision the board can change.
Covered by earnings, covered by cash, or neither
Two coverage tests give different answers here. Against earnings, fiscal 2025 diluted EPS of $1.21 sat below the year’s distribution, and in fiscal 2023 EPS of $1.09 did too. Earnings for a partnership carry heavy depreciation, so I do not put much weight on that test. Cash is the fairer measure, and the financials tab gives us the pieces.
Operating cash flow was $10.15 billion in fiscal 2025 against $4.72 billion of cash distributions, so before any investment the payout is covered 2.15 times. After capital spending it is not. Spending of about $6.3 billion, up from $4.2 billion in 2024, left free cash flow of $3.85 billion. That is the 0.81x figure.
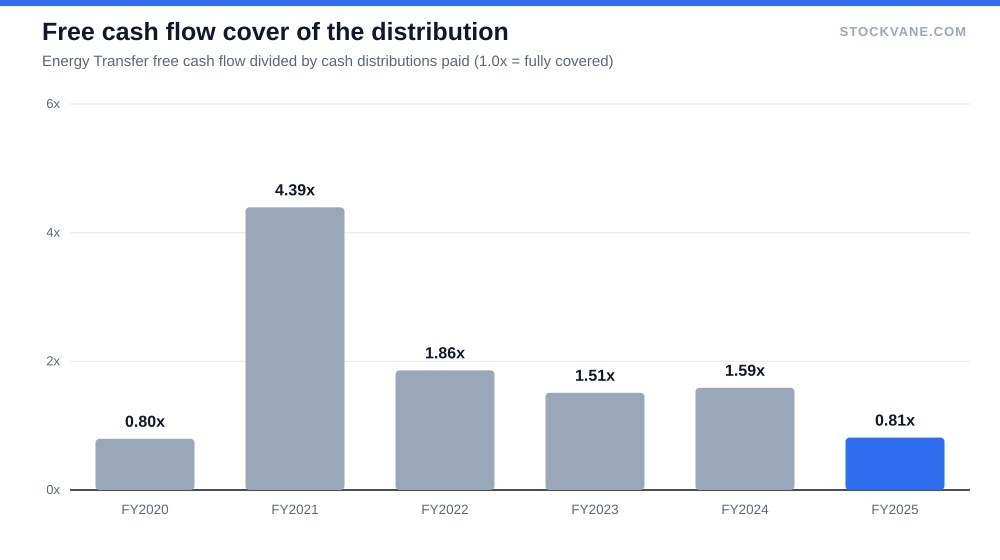
The chart shows how unusual last year was. Free cash flow covered the distribution by 1.5x in 2023 and 1.6x in 2024, and the only earlier year below 1.0x was 2020, when the payout was cut.
I want to be careful about what that gap means, because it is the one thing I cannot resolve from our data. If most of the $6.3 billion went to growth projects, management can slow spending and cover returns above 1.0x quickly. If a larger share is maintenance, the payout is more exposed. The company reports a separate measure of distributable cash flow that adds growth spending back, and we do not carry it. That uncertainty is the main reason I would not call this a set-and-forget income holding.
The balance sheet tells the same story from another side. Long-term debt rose from $60.5 billion to $69.8 billion in fiscal 2025, an increase of $9.3 billion. Interest coverage fell from 3.63 in fiscal 2022 to 3.27 and then 2.74. Neither number is alarming for a company with long-dated contracts, but the direction is not the one you want in a name whose payout is not fully covered by free cash flow.
What the toll road is made of
The usual description of a pipeline partnership is a toll road: volumes flow, fees are collected, commodity prices do not matter much. Energy Transfer fits that description only in part. In the latest reported quarter, its Sunoco fuel distribution investment made up 42% of revenue, crude oil transportation and services 32%, and natural gas liquids and refined products 22%. The two segments most people picture as toll roads, interstate and intrastate natural gas transportation, made up under 2% each. Revenue is not profit, and fuel distribution is a thin-margin business, so the profit mix looks different. Still, most of the top line moves with product prices.
Morningstar’s write-up, which appears on our quote page, agrees with the caution. Its analysts give Energy Transfer no economic moat and a medium uncertainty rating, with a fair value of $24 and four stars. Up to 90% of earnings before interest, taxes, depreciation and amortization come from fee-based revenue, they write, but the partnership accepts commodity risk and has grown through large acquisitions. It also flags legal proceedings around the Dakota Access Pipeline as a risk, while viewing a decommissioning as unlikely. Those are the analyst’s words, not ours.
One factor works in unitholders’ favor. Executive Chairman Kelcy Warren holds about 455 million units, roughly 13.2% of the total, according to the ownership records in our data. That is a large stake to have on the same side as outside holders, though it also concentrates influence over the payout in one person.
The rating that disagrees with the analysts
Here is the set of numbers I would want in front of me before deciding.
| Metric | Value | Read |
|---|---|---|
| Distribution yield (TTM) | 6.32% | Before any K-1 filing cost |
| Latest quarterly distribution | 34.00 cents per unit | Up from 33.25 cents three quarters earlier |
| Free cash flow cover, FY2025 | 0.81x | Was 1.59x in FY2024 |
| Trailing P/E | 14.5x | Five-year average 11.7x; industry 16.5x |
| Analyst ratings | 86% buy, 14% hold | 14 analysts; average target $24.86 |
| StockVane quant rating | C, score 58 | Was D, 54 on September 15 |
| Morningstar | Fair value $24, four stars | No moat, medium uncertainty |
The valuation numbers are less demanding than the yield might suggest. On the valuation tab, trailing P/E is 14.5, above the five-year average of 11.7 and near the top of its usual band at 15.0. Forward P/E is 11.9, against an industry average of 16.5. Price-to-book is 2.1 against a five-year average of 1.4. So Energy Transfer is cheaper than its industry on earnings and richer than its own history on both measures. The shares also sit 40% above their 52-week low.
Twelve of the 14 covering analysts rate the stock a buy and two a hold, with none at sell. Their average price target of $24.86 is about 18% above the price, with a range from $22 to $34. The analyst page has the full list. StockVane’s quant rating sits at a C with a score of 58, after a D of 54 on September 15. Sell-side targets and a systematic score answer different questions. The first asks what the units might be worth in a year. The second scores how the stock has traded and how it is priced. When they disagree, I would not pick a side. I would ask which assumption is doing the work.
Short interest gives no help in resolving it. About 0.8% of the float is sold short, roughly 3.3 days of average volume, so there is no crowded bet against the name. The last four earnings days produced an average move of about 0.7%, which is small for a company with this much debt. I read that as a market that treats Energy Transfer as a bond substitute and not as a growth story.
One ratio to watch before you buy
Energy Transfer suits an investor who has already decided that a K-1 is manageable and who is content with a distribution that grows by small steps. It does not suit someone counting on the 6.32% yield as guaranteed income, and it makes the least sense for a small position where the filing cost eats a fifth or more of the income.
The number I would wait for is the fiscal 2026 cash flow statement. If free cash flow covers cash distributions again, near the 1.5x seen in 2023 and 2024, the payout looks like a choice made from strength. If it stays below 1.0x while debt keeps climbing above $70 billion, I would expect the quarterly raises to slow. I would hold any position with the memory of 2020 in mind.
Financial disclaimer: The content on StockVane is for educational and informational purposes only and should not be construed as professional financial advice. Stock market investing involves risk of loss.
Sources: Dividends (SEC Investor.gov glossary) (https://www.investor.gov/introduction-investing/investing-basics/glossary/dividend) · Dividends tax topic (IRS) (https://www.irs.gov/taxtopics/tc404)