
Altria’s board added five cents to the quarterly dividend this month, taking it from $1.06 to $1.11 a share. It did so after a year in which earnings per share fell 37%, from $6.54 to $4.12. Either the board is ignoring a warning or the warning is not what it looks like.
I think it is the second. The 2025 drop happened below the operating line, and operating income, the number that pays for everything, rose. At $69.52 the stock yields about 6.2% on the last four payments, and the case for owning it rests on whether that payment is covered by a business that sells fewer cigarettes each year.
My read is that it is covered, with less room than the yield suggests and more than the 2025 EPS implies. The evidence is in three places: the operating income line, the payout ratio on three different earnings figures, and the price the company gets per pack.
Operating income did not fall. Earnings did.
Start with the financials tab. Operating income was $11.92 billion in 2022, $11.55 billion in 2023, $11.63 billion in 2024 and $12.04 billion in 2025. That is a range of under $0.5 billion across four years. Operating margin was 56.9% in 2024 and 59.8% in 2025.
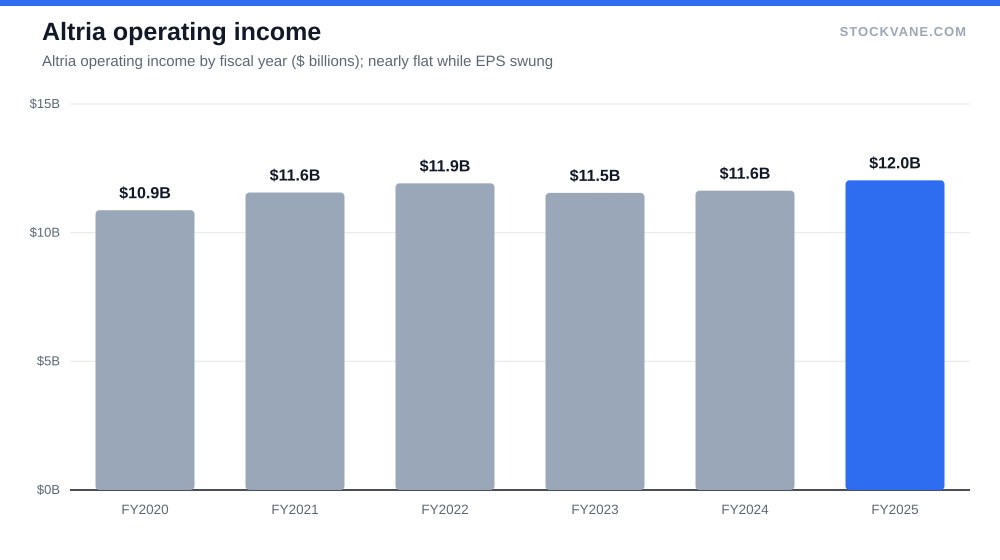
Net income tells another story: $11.26 billion in 2024, $6.95 billion in 2025. A $4.3 billion swing under a flat operating line means the difference sat in items below it. This data set does not say which ones, and I am not going to guess. What matters for the dividend is that the recurring business, the one that sells cigarettes and oral products, made about 3.5% more operating profit last year than the year before.
Read that against the EPS history and the reason for caution becomes clear: $1.34 in 2021, $3.19 in 2022, $4.57 in 2023, $6.54 in 2024, $4.12 in 2025. A payout ratio calculated on any single one of those numbers is a coin flip. Use the operating line to judge the business and treat EPS as a noisier check on it.
Three earnings numbers, three payout ratios
The current annualized dividend is $4.44 (four times $1.11). The last four payments actually sum to $4.29. Set against the earnings figures below, the payout looks different every time.
| Earnings basis Annual dividend | $4.44 (today) | $4.66 (+5%) | $4.88 (+10%) |
|---|---|---|---|
| 2025 diluted EPS ($4.12) | 108% | 113% | 119% |
| Trailing EPS ($4.75) | 93% | 98% | 103% |
| Forward EPS ($5.73) | 78% | 81% | 85% |
On 2025 diluted EPS of $4.12, the payout is 108%, which is what people quote when they call the dividend unsafe. On trailing earnings of about $4.75, derived from the price and the valuation tab‘s P/E of 14.6, it is 93%. On forward earnings of about $5.73, implied by a forward P/E of 12.1, it is 78%.
Which one is right? I would pick the middle. The trailing figure includes two recent quarters of net income near $2.2 to $2.3 billion, in line with the run rate the business showed before 2025’s drop, while the forward figure requires analysts to be correct. A 93% payout leaves little room for a bad year, and nothing for a big buyback on top.
The quarterly figures show where the volatility sits. Net income was $2.38 billion in one 2025 quarter, then $1.12 billion in the next, down 63% from a year earlier, then $2.18 billion and $2.30 billion in the two most recent. One quarter carried most of the damage. Over the last four quarters net income adds up to about $8.0 billion, and that, not the $6.95 billion of 2025, is what the payout has been drawing on lately.
The pace of raises is slowing, too. The dividend rose 3.9% a year ago (from $1.02 to $1.06) and 4.7% this month. Neither is a large raise, and both are far below the 40%-plus earnings growth of 2023 and 2024. That suggests the board is choosing to keep the streak alive while the payout ratio stays high.
Price up, volume down
Revenue has slipped from $20.69 billion in 2022 to $20.14 billion in 2025, a 2.7% decline over three years. Gross margin over the same period climbed from 68.9% to 72.2%. Fewer units, higher price and better margin per unit: that is the whole model in two lines.
Morningstar’s analysts, whose notes sit in our data, make the same point with an estimate. Over the past decade they figure Altria’s volume fell about 7% a year while prices rose about 6% a year. They forecast volume declining roughly 4% a year from here. Those are estimates rather than reported figures, and the direction matches what the income statement shows.
The most recent quarters carry a small surprise. Quarterly revenue growth was -2% and -1% in the two quarters of 2025, then +5% and +1% in the two most recent, with the latest at $5.36 billion. One year of flat sales does not prove the decline is over. It does show the price side of the equation has been winning by a little more than volume has been losing.
Smokeable products were 88% of the latest quarter’s revenue and oral products 12%. That is a very concentrated business. Whatever happens to cigarette volume, there is little else to cushion it.
What 14.6 times earnings pays for
The stock trades at 14.6 times trailing earnings, against a five-year average of 16.7 on the valuation page and an industry average of 19.8. At a forward P/E of 12.1 it is cheaper again. The obvious reading is that the market is charging a discount for a shrinking product, and the discount is about 26% below the industry average on trailing earnings.
The price-to-sales ratio pulls the other way. It is 5.0, against a five-year average of 3.7 and in the 96th percentile of its own history. On sales, the stock is expensive relative to itself; on earnings, it is cheap relative to peers. Both are true because margins are high: Altria keeps a lot of each sales dollar, so the sales multiple looks stretched while the earnings multiple looks modest.
A 6.2% yield is a large share of the return an investor can reasonably expect here. If volume keeps falling and pricing keeps pace, the price of the stock has little reason to rise, so total return is roughly the yield plus whatever the dividend grows by, minus any multiple compression. That is a workable income holding. It is not a growth stock with a dividend attached.
Price has moved little since spring. The stock closed June at $71.95 and July at $68.33, and sits 8% below the 52-week high of $75.85 and 33% above the low of $52.17. Morningstar’s fair value in our data is $71, about 2% above today’s price. That is not a margin of safety, and it is not a warning either.
Reactions to earnings have skewed negative. The last five reports moved the shares -9.3%, +6.5%, -5.3%, -7.8% and +3.6%. Three of five days were declines of more than 5%. A holder who buys for the yield should expect earnings day to be uncomfortable.
Ten analysts, and half say hold
Of the 10 analysts on the analysts tab, 40% rate Altria a buy, 50% a hold and 10% a sell. The average target is $73, 6% above the price, with a range from $58 (17% below) to $82 (18% above). I read a group that is comfortable with the income and unwilling to pay for growth, which is a reasonable place to be.
| Metric | Value | Context |
|---|---|---|
| Price (approx.) | $69.52 | 52-week range $52 to $76 |
| P/E (TTM) | 14.6x | Five-year average 16.7x |
| Price-to-sales | 5.0x | Five-year average 3.7x |
| Analyst ratings | 40% buy, 50% hold | 10 analysts; average target $73 |
| Dividend yield | 6.10% |
Our quant score sits at a C with a score of 41, down from a C at 57 on September 14. That is a big move inside a single grade band, and I would not read it as a signal on its own. Short interest is about 2.5% of float, which does not suggest a crowded bet against the stock.
What could break the streak
The obvious risk is volume falling faster than pricing can offset. Morningstar’s own numbers show how narrow the margin is: 7% volume decline against 6% price increases still left revenue slightly lower. If volume drops 8% or 9% for a few years, or if smokers push back on price, the trade stops working. The company has no second large business to lean on, since oral products are only 12% of the quarter.
Regulation is the second. Morningstar estimates that menthol accounts for about 20% of Altria’s revenue and operating profit, and it notes that a future ban is still possible even though the near-term risk has eased. I have no view on whether that happens, only that it is a discrete event and cannot be modeled as a smooth decline.
Equity is the third, and a quiet one. Book value is negative: the P/B on the valuation page is -43.9. Years of buybacks and payouts have taken equity below zero, which is common for a mature payer. It still leaves the balance sheet with no cushion if the dividend stops being covered.
I am not covering debt or cash flow here. Those tables are not in the data I use for this note, and payout safety without them is an earnings argument only.
Two prints that would test the payout
The next report is due October 29. The quarterly dividend costs about $1.85 billion at $1.11 a share. If quarterly net income comes in below that, the quarter did not cover its own payment, and I would move the payout from “tight” to “stretched” in my notes. Above roughly $2.2 billion, in line with the last two reports, the 93% figure holds. Revenue matters as much: a fall back below 0% year over year would say that pricing is starting to lose. Until one of those shows up, 70 for a 6.2% yield is a fair price for a decaying, well-run cash machine.
Financial disclaimer: The content on StockVane is for educational and informational purposes only and should not be construed as professional financial advice. Stock market investing involves risk of loss.
Sources: Dividends (SEC Investor.gov glossary) (https://www.investor.gov/introduction-investing/investing-basics/glossary/dividend) · Dividends tax topic (IRS) (https://www.irs.gov/taxtopics/tc404)