
The next Comcast dividend goes ex on October 7, and it will be $0.33, the seventh payment at that size. The title of this piece promises a growing dividend. The payment history says it grew through April 2025 and has been flat since. Both facts matter, and the second one is the more interesting.
Start with what the record shows. The quarterly payment was $0.29 through the January 2024 payment, $0.31 from April 2024, and $0.33 from April 2025. Those are raises of about 7% and 6.5%. Annualized, the dividend is $1.32 a share on a stock at $22.74, a yield of 5.80%. The market is not pricing a dividend at risk. It is pricing a business it does not want to own at any multiple, and that is a different problem.
Here is the thesis. Comcast’s dividend is safe because it is small relative to cash the business throws off, and the stock is cheap because that cash is not growing. Cash coverage settles the first half. The second half needs the revenue line, the debt and one accounting swing that flatters 2025.
Revenue that does not move
Comcast’s revenue was $121.4 billion in 2022 and $123.7 billion in 2025. In between it printed $121.6 billion and $123.7 billion. Three years, essentially no growth, in a company that sells to hundreds of millions of customers.
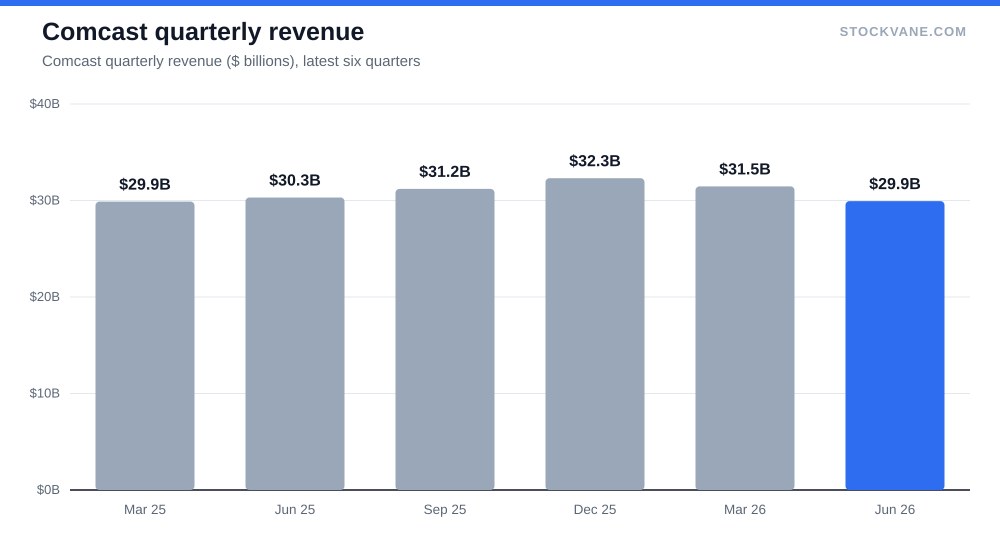
The latest quarter, reported in July, was $29.9 billion, down 1% from a year earlier and down 5% from the quarter before. The four quarters before that ran $31.2 billion, $32.3 billion and $31.5 billion. That is a business drifting toward a $120 billion run rate ($119.8 billion annualized from the latest quarter), not falling off a cliff.
Where the money comes from matters here. In the June quarter, Residential Connectivity & Platforms brought in $17.1 billion, 57% of revenue. Media was $5.7 billion, 19%. Studios added $3.0 billion, Business Services Connectivity $2.7 billion and Theme Parks $2.4 billion. More than half the company is a broadband and connectivity franchise. I do not have subscriber counts in the database, so I am not going to guess how fast the video line is shrinking. What I can say is that the mix has not translated into growth in the headline.
Earnings that look better than they are
Diluted EPS went from $1.21 in 2022 to $5.39 in 2025. Net income went from $4.9 billion to $19.7 billion. On flat revenue, that reads like a turnaround.
Read it more carefully. The 2022 figure was depressed, down 60% on the year, and that low base does most of the work in a “fourfold” comparison. From 2023 to 2025, EPS moved from $3.71 to $5.39, a gain of 45%. Better, still large. But operating income fell in 2025, from $23.3 billion to $20.7 billion, a drop of 11%. Net income rose while operating income fell.
The cash flow statement explains part of the gap. It subtracts an $8.9 billion gain from net income before arriving at operating cash flow, which tells me a non-cash gain sits inside the $19.7 billion. I do not have the source of it in the database, so I treat it as a one-off and I read 17% operating margin, not the 24.4% EBIT margin the database also carries, as the honest number for the underlying business. The two differ because the EBIT figure picks up items below the operating line.
The trailing P/E of 7.3 against $3.12 of trailing EPS is the market doing the same subtraction. Trailing EPS of $3.12 is $2.27 below the FY2025 figure. The stock is not trading on $5.39.
Why the dividend is safe
Comcast paid $4.9 billion in dividends in 2025. Free cash flow, after $11.8 billion of capital spending and $2.7 billion of intangibles spending, was $19.2 billion. The dividend consumed 25% of it. Add $7.2 billion of net buybacks and the company returned $12.0 billion, 63% of free cash flow.
Compare that with earnings. The payout is 24% of FY2025 EPS and 42% of trailing EPS. Either way it clears with room.
The cash figure deserves more suspicion than the EPS one, so here is the test. Free cash flow was $12.5 billion in 2024 and $19.2 billion in 2025, a jump of $6.7 billion. Working capital swung from a $4.9 billion drain in 2024 to a $2.2 billion inflow in 2025. That $7.1 billion swing is larger than the entire improvement. So a big part of last year’s cash surge was timing. Strip it out and 2025 looks like the $12.5 billion to $13.0 billion the company produced in 2023 and 2024.
Does that break the case? No. At $13 billion of free cash flow, the $4.9 billion dividend is still covered 2.7 times. That is the conservative version of the argument, and it still holds. The dividend would need free cash flow to fall by about 60% before the payment was uncovered.
For readers weighing this kind of income stock against a grower, the trade-off is laid out in our yield versus dividend growth piece. Comcast is now on the yield side of it.
The debt is the real constraint
Total debt was $98.9 billion at the end of 2025: $6.0 billion due within a year and $93.0 billion long term. Cash was $9.5 billion. Net debt was about $89.5 billion. Two years earlier, total debt was $97.1 billion, so the balance has barely moved.
Against operating income plus depreciation and amortization ($20.7 billion plus $16.2 billion, my arithmetic, not a company-reported EBITDA), net debt is about 2.4 times. That is not comfortable for a company with no revenue growth. It is manageable for one with $13 billion or more of steady free cash flow. Equity was $96.9 billion against total liabilities of $175.3 billion, so nobody is going to describe this balance sheet as thin.
Why does the dividend stall while debt sits there? My inference: management is choosing to hold the payment at $0.33 and put the surplus into buybacks and cash, which rose from $7.3 billion to $9.5 billion in 2025. The data show the pause. They do not show the motive.
What the valuation says
| Metric | Value | Context |
|---|---|---|
| Price (approx.) | $22.74 | 52-week range $21 to $32 |
| P/E (TTM) | 7.3x | Five-year average 14.1x |
| Price-to-sales | 0.6x | Five-year average 1.3x |
| Analyst ratings | 38% buy, 56% hold | 16 analysts; average target $29 |
| Dividend yield | 5.80% |
At $22.74 the stock trades at 7.3 times trailing earnings, against a five-year average of 14.1. On the valuation tab the price-to-sales ratio is 0.6 against a five-year average of 1.3, and price to book is 0.9 against 1.8. Forward P/E is 7.4 on $3.06 of expected earnings, which implies a -2% change from the trailing figure.
Market value is $80.7 billion. The stock sits 29.0% below its 52-week high of $32 and only 7% above the low of $21.
Analysts are divided: of 16, 38% rate it a buy. The average target is $29, 29% above the price; the lowest is $23, essentially the current price. The quantitative score in our tool fell from B to E in the last few weeks. Short interest is 2.3% of float, not an amount that suggests a crowded bear trade.
The counter-case
There is a second way to read the low multiple, and it deserves a hearing before the bear case. Investors have been burned by companies that looked cheap on earnings because a one-time gain inflated the denominator. Comcast’s FY2025 EPS of $5.39 may be one of those denominators. If so, the trailing $3.12 is the cleaner base and 7.3 times is the number to use, not 4.2 times, which is what $22.74 over $5.39 would suggest. I use 7.3 throughout for that reason.
The bear argument is simple and has data behind it. Revenue is flat, operating income fell 11%, the July report drew a -6.8% one-day move against an average of 5.4%, and the quarterly payment has stopped rising. A stock at 7 times earnings can be a value trap if earnings keep shrinking, because a low multiple on a falling number is not cheap.
I take that seriously, and I cannot rebut it with the database alone. What I can say is that the multiple already contains it: 7.3 times earnings against a 14.1 average means the market is pricing a shrinking company. If operating income merely stays at $20.7 billion, the stock is cheap for its cash. If it falls another 11% for two years, it is not.
I am not covering the video subscriber trend, the spinoff details or theme park attendance. The database does not have clean numbers for them, and a paragraph without figures would only be decoration.
What would change the call
Three thresholds. Free cash flow below $10 billion on a trailing basis would make the coverage argument much tighter. Operating income under $18 billion would confirm the bear case on earnings. A dividend raise at the next declaration would be the cheapest proof that management sees the cash the way the numbers suggest.
The last one is the closest. If the board holds $0.33 into 2027, that is two full years without a raise at a company that raised twice in the two years before. I would then stop calling this a dividend-growth story and file it as a high-yield holding with a 5.8% payment and a balance sheet to watch.
Financial disclaimer: The content on StockVane is for educational and informational purposes only and should not be construed as professional financial advice. Stock market investing involves risk of loss.
Sources: Comcast SEC filings (EDGAR) (https://www.sec.gov/cgi-bin/browse-edgar?action=getcompany&company=comcast&type=10-K&dateb=&owner=include&count=10).