
Rank Cadence and Synopsys by price to earnings and Synopsys is the expensive one, 67.3 times trailing profit against 56.2 for Cadence. Rank them by price to sales and the order flips, 13.3 for Cadence, 8.1 for Synopsys. Same two tools, same customers, opposite verdicts, and the difference comes down to one accounting event.
Nearly every advanced chip is designed on software from these two companies. Both stocks sit well below their highs (32.1% for Cadence, 29% for Synopsys), and analysts want to own both: 94% of 16 rate Cadence a buy and all 15 covering Synopsys do. Their average targets imply the same 47% of upside. So the market agrees on direction and disagrees on price, which makes this pair a clean test of what a P/E is measuring. My argument is that Synopsys’s multiple is inflated by the Ansys acquisition and Cadence’s is not, and that the sales multiple is the fairer yardstick until the comparison base resets in December.
| Measure | Cadence (CDNS) | Synopsys (SNPS) |
|---|---|---|
| Price | $282.90 | $384.97 |
| Below 52-week high | 32.1% | 28.6% |
| Trailing P/E | 56.2 | 67.3 |
| Forward P/E | 55.7 | 70.5 |
| Price to sales (current / 5-year average) | 13.3 / 16.6 | 8.1 / 10.3 |
| Latest quarter revenue, growth | $1.58B, +24% | $2.48B, +42% |
| Gross margin, fiscal 2025 | 86.4% | 77.0% |
| Analysts rating it a buy | 94% of 16 | 100% of 15 |
| Average target (upside) | $417 (+47%) | $564 (+47%) |
The table is the snapshot from September 18. Everything that follows explains why the two P/E rows should not be read against each other.
Two P/Es that are not comparable
Cadence earned about $5.03 a share over the last twelve months, up 24% from its fiscal 2025 figure of $4.06. Its four most recent quarters of net income add up to $1.38 billion, and the latest, $367 million, is more than double the $160 million of a year earlier. That is a clean rise, so the 56.2 multiple sits on a rising base.
Synopsys is the opposite. Trailing EPS works out to $5.72, down 29% from the $8.04 it reported for fiscal 2025. Quarterly net income went from $448 million to $65 million, then $17 million, and then jumped to $546 million in the latest report. Acquisition costs, amortization of acquired assets and interest on the debt that funded Ansys all land in those middle quarters. I read the two thin quarters as the price of closing the deal, and the $546 million quarter as either a return toward normal or a one-off gain. The database does not say which.
Fiscal 2024 adds a wrinkle. Synopsys reported net income of $2.24 billion that year, then $1.33 billion in fiscal 2025. I would not treat the earlier figure as a baseline. Anyone comparing trailing P/E to a five-year history that includes a year like that is comparing against noise. On the valuation tab, the P/E is 69.5 against a five-year average of 49.0, an 83rd percentile reading. Cadence sits at 56.2 against 72.2, the 5th percentile of its own range.
Take the chart at face value and Cadence looks cheap against itself and Synopsys looks expensive against itself. Both statements are true and neither is useful. Cadence’s history is a run of steady 20%-plus EPS growth that ended in fiscal 2024, so today’s multiple is compressed against a period when investors paid for that pace. Synopsys’s history is a smaller, cleaner company. Paying 67 times an EPS that is temporarily depressed by a deal says little about the business you are buying.
What the sales multiple says
Price to sales avoids the earnings distortion, and it reverses the ranking. Cadence trades at 13.3 sales against a five-year average of 16.6. Synopsys trades at 8.1, against 10.3 for its own five years. On forward sales, Cadence is at 11.6 and Synopsys at 7.3. Each dollar of Synopsys revenue costs about 60% of what a dollar of Cadence revenue costs.
That discount deserves an explanation and not a compliment. Synopsys has the lower gross margin, 77.0% in fiscal 2025 against 86.4% for Cadence, because a share of what it now sells (simulation software, plus design IP) carries different economics from core design automation. Cadence keeps roughly ten more cents of every revenue dollar before operating costs. A lower sales multiple on a lower-margin revenue base is not a bargain by itself. It is a fair price for a different mix.
Even so, the size of the gap gives Synopsys room. Its fiscal 2025 revenue was $7.05 billion against $5.3 billion for Cadence, and its market value is $73.8 billion against $77.9 billion. The market is paying more for the smaller revenue stream, not the larger one. That only works if you believe Cadence’s margin and growth justify a premium, which is where I land for now, with reservations covered below.
There is a counterpoint I take seriously. A low sales multiple can be a trap if the sales are of poor quality, and reported operating income at Synopsys fell to $0.91 billion in fiscal 2025 from $1.36 billion the year before, even as revenue rose 15%. Cadence, meanwhile, grew operating income in the same period. If that pattern of rising sales and shrinking profit continued for another year, the sales multiple would be the wrong yardstick, and I would stop leaning on it. So far, one year of it looks like integration cost, not a change in the franchise.
The Ansys effect on growth
Reported revenue growth at Synopsys over the last four quarters was 38%, 66%, 42% and 42%, on quarterly revenue of $2.25 billion, $2.41 billion, $2.28 billion and $2.48 billion. Cadence grew 10%, 6%, 19% and 24% on $1.34 billion, $1.44 billion, $1.47 billion and $1.58 billion.
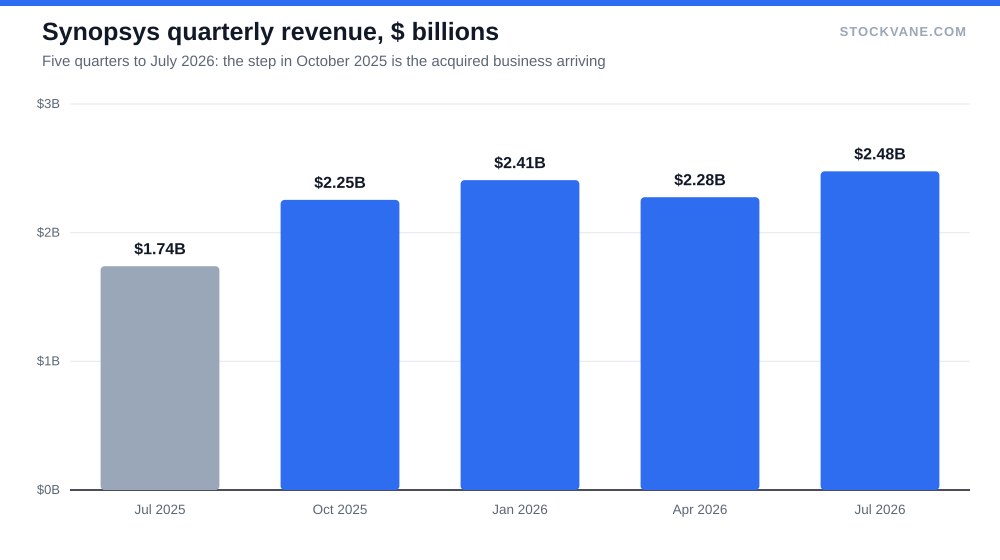
Read the Synopsys sequence carefully. Revenue went from $1.74 billion in the July 2025 quarter to $2.25 billion in the next, a step of about $0.52 billion, and has moved in a band of $2.25 to $2.48 billion since. That step is the acquired business arriving. It is not organic growth. Every year-over-year figure in the paragraph above the chart includes it, which is why 42% cannot be read as the underlying rate. The database does not split organic from acquired revenue, so I will not estimate it.
Compare that with the sequential quarter. Synopsys grew 8.8% from the previous quarter, and Cadence 7%. Those are close. Strip out the step and the two growth rates are much nearer each other than the headlines suggest. That is my main point on growth: Cadence’s 24% is the number that reflects a business accelerating, while Synopsys’s 42% flatters it.
What the analysts and the tape say
Analysts put Cadence’s average target at $417 (range $349 to $470) and Synopsys’s at $564 ($475 to $633). Both imply about the same 47% upside, and neither covers a sell. A one-way consensus like that tells you the debate has moved on to price, but it also means the bar for a positive surprise is high.
The quant score is less kind. Cadence’s rating is E today, down from C at the start of our 40-day window, and Synopsys is at D, down from C. I treat that as a note about recent momentum and revisions, not a verdict, but it does agree with prices sitting 32.1% and 29% below their highs. Short interest is 2.1% of float at Cadence and 2.7% at Synopsys, which is too little to matter either way.
The last earnings reactions differ. Cadence moved +1.8% after its July 27 report, against an average move of 5.5%, so the market shrugged. Synopsys rose 13.4% after its August 26 report, following declines of 8.6% and 5.2% in the two reports before. If you want a way to read reports like these, our guide to how to read an earnings report covers the GAAP versus adjusted question that matters most here.
What would make me wrong
Two conditions. First, if Synopsys shows that its stripped-down earnings, once deal costs fade, run well above the $5.46 of forward EPS implied by the 70.5 forward multiple, then the 67 times is a mirage and the stock is cheaper than the sales multiple suggests. Second, if Cadence’s growth slips back toward the 6% it posted three quarters ago, the 13.3 sales multiple has no support. Its own price history suggests the market already knows this: shares are 8% above the 52-week low of $263, so the cushion is thin.
I am not covering the two companies’ competitive positions beyond what the segment data shows, nor the export-control questions that touch chip design software. Those matter, but I have no database figures for them, and I would rather leave them out than guess. For a wider picture of who else profits from the chip build-out, see our piece on ASML, and for another case where a market multiple obscures the business, Costco at 50 times earnings.
The quarter that decides which multiple to trust
Synopsys’s fiscal fourth quarter ends in October, and last year’s report came on December 10. It is the first quarter whose comparison base already contains Ansys, at $2.25 billion. If revenue simply holds at the latest $2.48 billion, reported growth drops from 42% to about 10%. Every extra $100 million adds roughly 4.4 points.
That is the number I would circle. If Synopsys prints growth of 10% or more and a net income line back near the $448 million it earned before the deal costs, the earnings multiple starts to come down on its own and the discount to Cadence on sales looks earned. If growth lands in the single digits with profit still in the tens of millions, I would keep Cadence as the cleaner of the two and treat the low sales multiple at Synopsys as the market’s fair price, not a discount.
Financial disclaimer: The content on StockVane is for educational and informational purposes only and should not be construed as professional financial advice. Stock market investing involves risk of loss.
Sources: Price-to-earnings ratio (SEC Investor.gov glossary) (https://www.investor.gov/introduction-investing/investing-basics/glossary/price-earnings-pe-ratio) · Earnings reports (SEC Investor.gov glossary) (https://www.investor.gov/introduction-investing/investing-basics/glossary/earnings-report)