
Between July 15 and August 31, Moderna’s share price went from $68.28 to $140.34. Over the same stretch, the share of its float sold short fell from 13.2% to 9.8%. Read together, those two numbers look like a crowd walking out of a room while the price doubled behind it.
Nebius tells the opposite story, and it sits at the top of the list. As of the August 31 reading, 16.7% of its float was sold short. That is the highest of the 300 stocks StockVane covers, and it is nearly seven points clear of Moderna in second place. My argument in this piece is narrower than “shorts are wrong” or “shorts are right.” The Nebius bet is real but shrinking, the second tier is crowded in a different and stickier way, and the two columns of the table below measure two separate risks that people habitually blend into one.
Short interest, for anyone new to it, is the number of shares that investors have borrowed and sold, planning to buy them back cheaper. Our data comes from the exchange reporting cycle, twice a month, and the newest reading is dated 2026-08-31. The price data runs to September 18, which is why some of the moves below extend past the short-interest date and I say so where it matters.
The twelve most shorted stocks
| Stock | Short % of float | Change since July 15 | Days to cover | Market cap |
|---|---|---|---|---|
| Nebius (NBIS) | 16.7% | -7.4 pts | 2.3 | $61B |
| Moderna (MRNA) | 9.8% | -3.4 pts | 1.0 | $61B |
| Carvana (CVNA) | 9.2% | -1.5 pts | 7.3 | $47B |
| Lumentum (LITE) | 7.9% | -3.4 pts | 1.7 | $84B |
| Bloom Energy (BE) | 6.5% | -0.2 pts | 1.6 | $78B |
| Western Digital (WDC) | 5.5% | -1.2 pts | 3.1 | $159B |
| Coherent (COHR) | 5.5% | +1.1 pts | 1.7 | $62B |
| Canadian Natural (CNQ) | 5.5% | +3.2 pts | 20.5 | $102B |
| Snowflake (SNOW) | 5.2% | -1.0 pts | 4.9 | $117B |
| Union Pacific (UNP) | 4.7% | -0.1 pts | 10.8 | $166B |
| Teradyne (TER) | 4.5% | -0.2 pts | 2.9 | $58B |
| American Electric Power (AEP) | 4.5% | -1.6 pts | 7.2 | $65B |
A few things stand out before any story. Only 9 of the 300 stocks have 5% or more of their float sold short, and just 1 clears 10%. The average across the whole list is 1.98%, and 171 names sit under 2%. Apple is at 0.96%, Nvidia at 1.24% and Tesla at 1.88%. Against that background, Nebius at 16.7% is an outlier by any standard.
The second thing is size. These are not obscure small caps. Ten of the twelve carry market values above $60 billion, and Union Pacific is at $166 billion. Crowded shorting in this dataset is a large-cap phenomenon, which changes the risk: borrowing is easy, liquidity is deep, and a squeeze has to be fed by real news rather than by a thin float.
Nebius: from 24% to 16.7% in seven weeks
The Nebius quote page shows a stock at about $61 billion. The short position built quickly and then unwound. Between April 15 and May 29 it sat in a narrow band around 17% of float. On June 15 it reached 20.1%, and on June 30 it hit 24.0%. The share price fell from $276 on June 30 to $199.51 on July 15, and the short position was still 24.1% that day. Shorts had added into the decline, and as of mid-July they had it about right.
Then the position came down. Shares short dropped from 61.1 million on July 15 to 45.3 million on August 31, a fall of 26%. That is roughly 15.8 million shares bought back. Note what the stock did meanwhile: it went from $199.51 to $206.32, a gain of about 3%. Nobody was forced out at a big loss. This looks like shorts taking profit or reducing risk after the drop, not a squeeze, and I would not describe it as capitulation.
The days-to-cover figure supports that reading. Nebius trades about 19.6 million shares a day, so the 45.3 million short would take 2.3 days of average volume to close. On July 15 the same measure was 3.5 days. A book that can be closed in two days is a trader’s short, not a permanent one.
For context on how the market prices AI infrastructure demand, our look at Oracle’s backlog covers another company selling to the same AI demand. Its balance sheet is different, and I would not carry conclusions across.
Moderna and Lumentum: shorts leaving as the price rose
The Moderna case is the cleanest in the table. Shares short fell from 52.4 million to 39.2 million between July 15 and August 31, and the price went from $68.28 to $140.34. Days to cover is 1.0. With 50 million shares changing hands on an average day, a short position this size can be closed in a single session. That is the profile of a position that has already been tested. Our database holds no news item for the period that would let me name a reason, so I will not offer one.
Lumentum shows the same pattern at a smaller scale. Its short interest dropped from 11.3% to 7.9% while the stock rose from $752 to $915. Again days to cover is under two.
I read both as cases where the market moved against the shorts and they reduced exposure. That is an inference, and the alternative, that shorts closed voluntarily and the stock rose for unrelated reasons, cannot be ruled out with twice-monthly data. What the numbers do show is that the two names have lost most of their crowd. Neither is a squeeze candidate any more, whatever the ranking implies.
Days to cover: where the exit is narrow
The other column matters more for anyone who worries about a squeeze. Days to cover divides shares short by average daily volume, so it is a rough gauge of how many trading days the shorts would need to get out.
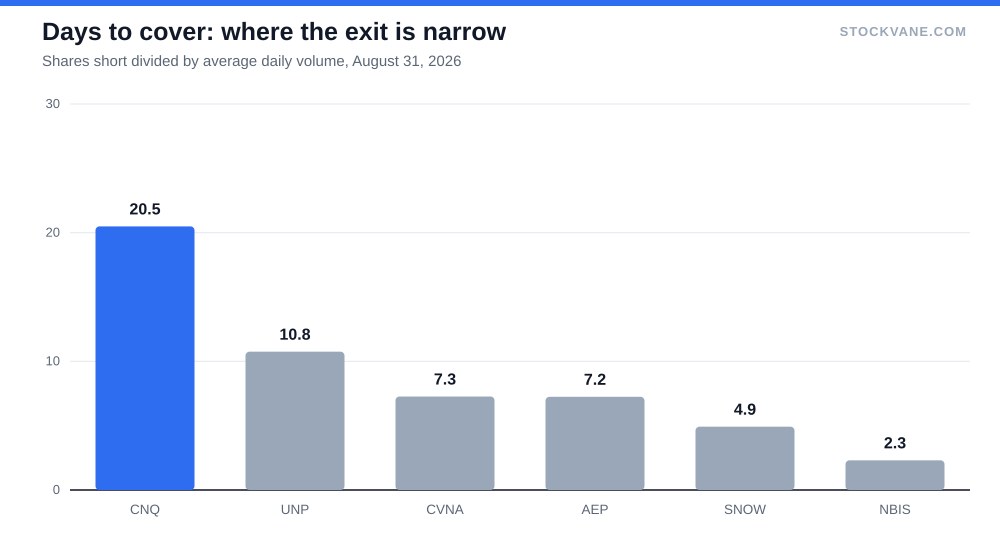
Union Pacific deserves a sentence of its own, because its position has barely moved. Short interest was 4.8% of float on July 15 and 4.7% on August 31, on a stock worth about $166 billion. Roughly 27.7 million shares are short against average volume of 2.6 million a day, which is how a mid-single-digit percentage turns into a 10.8-day exit. That is a slow, steady bet, closer to a position a fund holds against the railroad’s numbers than a trade.
Canadian Natural leads the entire list at 20.5 days. Its short interest more than doubled in seven weeks, from 2.3% to 5.5% of float, and daily volume is modest. Union Pacific follows at 10.8 days, and Carvana at 7.3. Nebius, with the biggest short position by share of float, needs just 2.3.
Carvana is the name I would put ahead of the others. At 9.2% of float it is third on the list, and at 7.3 days it is the only stock that is near the top on both columns. Shares short slipped from 10.6% in mid-July, and the price rose about 4% to $73.46 by August 31, but by September 18 the stock had fallen back to $65.11, below where it started. A short opened on July 15 was underwater on August 31 and ahead by September 18. The stock has gone nowhere useful for either side. Our Carvana financials are the place to start if you want to understand the debate.
The Canadian Natural reading needs a caveat. It is a Canadian company listed in the United States, and the float base used for a dual-listed name can differ from the one behind a purely domestic stock. I would treat its 5.5% as an indication of direction and not an exact level. The days-to-cover figure has the same limitation, since volume across two listings is not the same as volume on one.
What short interest cannot tell you
Three limits are worth stating plainly.
The data is old by the time you read it. The August 31 figure describes a position that has had at least three weeks to change, and Nebius moved more than seven points in seven weeks. Second, a short position is not always a bearish opinion. Some shares are sold short as hedges against a long position or against a convertible security in the same company, and the report does not say which. Third, only 105 of the 300 stocks saw short interest rise between July 15 and August 31. Most positions were shrinking, a broad move that no single-stock story explains.
A short seller has to be right about timing as well as value. Our Palantir valuation piece is a good example of an argument that hinges on what a growth stock must deliver, and the same discipline applies when you read a crowded short as a signal.
I would also push back on the common shortcut of reading a high short percentage as a bullish signal on its own. The crowd can be right for months. Nebius had a short position of 24.1% on July 15, and in the weeks before, the stock fell from $276 to $200. Those who bet against it were paid.
What I am not covering here is option positioning, which some traders use as a second read on crowding, or borrow fees, which we do not carry. Either would sharpen the picture.
The Nebius reading I would wait for
The number to watch is shares short. It ended August at 45.3 million, down from 55.4 million two weeks earlier. If the next report shows it climbing back above 55 million, the bears have decided the rebound to $206 and beyond is a place to sell again, and the 20% line becomes the level to watch. If it slips below 40 million while the price holds near $206, the crowd is gone and Nebius stops being the story in this table. I would not draw a conclusion in between.
Financial disclaimer: The content on StockVane is for educational and informational purposes only and should not be construed as professional financial advice. Stock market investing involves risk of loss.
Sources: Stock options tax topic (IRS) (https://www.irs.gov/taxtopics/tc427) · Federal Reserve monetary policy (https://www.federalreserve.gov/monetarypolicy.htm)