
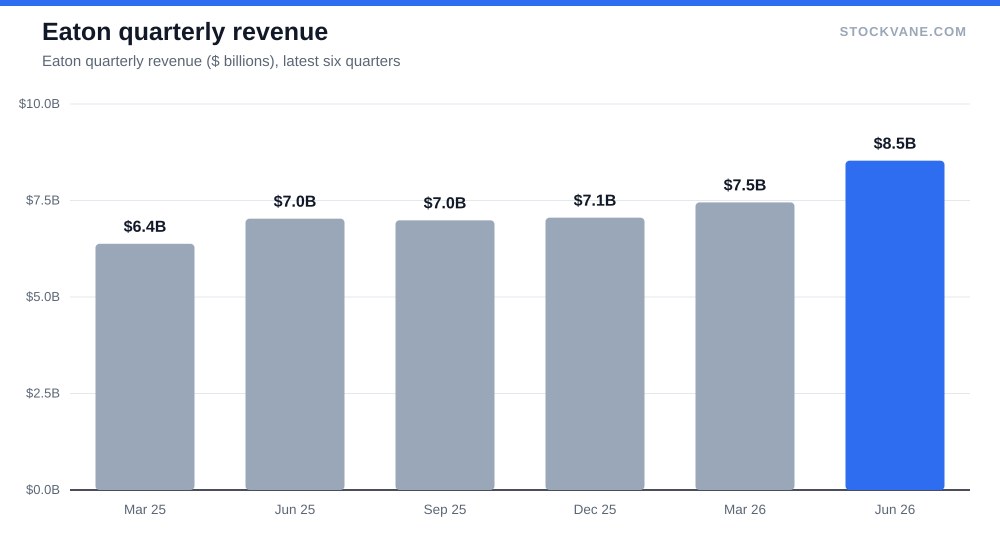
Four growth rates describe Eaton’s June quarter, and they do not agree. Revenue rose 21.4% to $8.5 billion. Operating profit rose 10.8%, to $1.39 billion. Net profit fell 16.2%, to $823 million. Diluted EPS fell 15.9%, to $2.11. A company whose sales grew a fifth in a year reported less profit per share than it did twelve months earlier, and the stock closed at $424.77, 11.1% under its 52-week high of $478, on 10 Buy ratings out of 10.
My reading is that the market is paying for revenue and the forward estimate, and the estimate needs a profit recovery that the last two quarters have not shown. At 43.1 times trailing earnings, against a five-year average of 32.7, Eaton is priced for the growth story to convert into per-share earnings. So far it has not. The rest of this post is about where the conversion is leaking, and what would show it stopping.
Four lines, four different directions
The quarterly sequence matters more than the single print. Here is what the financials tab shows for the last five quarters.
| Quarter ended | Revenue | Revenue growth | Operating profit | Net profit | Diluted EPS | EPS change |
|---|---|---|---|---|---|---|
| June 2025 | $7.03 billion | +10.7% | $1.26 billion | $982 million | $2.51 | +1.2% |
| September 2025 | $6.99 billion | +10.1% | $1.37 billion | $1.01 billion | $2.59 | +2.4% |
| December 2025 | $7.06 billion | +13.1% | $1.39 billion | $1.13 billion | $2.91 | +18.8% |
| March 2026 | $7.45 billion | +16.8% | $1.17 billion | $868 million | $2.22 | -9.4% |
| June 2026 | $8.53 billion | +21.4% | $1.39 billion | $823 million | $2.11 | -15.9% |
Revenue growth has accelerated for three straight quarters, from 10.1% in September to 21.4% in June, and the June quarter was 14% bigger than the March quarter in one step. Operating profit, the line above interest and tax, grew 13.1% and 12.9% in the two quarters before that, then dipped 2.4% in March and rose 10.8% in June. It is still growing. It is just growing at half the speed of sales.
Then look at the two lines below it. Net profit was $982 million in the June 2025 quarter and $823 million in June 2026, and EPS went from $2.51 to $2.11. Between operating profit and net profit sat $274 million a year ago. This June it was $569 million, more than double. Our data does not itemize what fills that space (interest, tax, or other charges could all be in it), so I will not guess. But it is the single most useful number in this post: over $500 million in a quarter that the market’s headline “sales up 21%” does not touch.
One more thing about the sales line. Sales jumped 14.5% from March to June, which is far more than steady demand usually produces. Acquisitions or other one-time items could be part of it, and the database does not separate organic growth from bought growth. If a good part of the 21.4% was purchased, the margin story below gets easier to explain and the growth story gets less impressive.
Margins gave back what volume added
Gross margin was 35.9% in the June quarter against 38.2% a year earlier, a drop of 2.3 points. The March quarter was 36.9% against 38.4%. So gross margin has now fallen for three straight quarters, from 38.1% in September 2025 to 37.6% in December, then 36.9%, then 35.9%. Each step is bigger than the one before it.
EBIT margin in the database tells the same story with a smaller drop, 17.5% against 18.9% a year earlier (I cite the database’s EBIT margin here, not a figure built from operating profit and revenue, since the two are calculated slightly differently). Selling and administrative costs evidently did not grow as fast as sales, which cushioned the gross-margin decline by about 0.9 points.
Full-year figures give the longer frame. Gross margin rose from 30.5% in fiscal 2020 to a peak of 38.2% in fiscal 2024, and slipped to 37.6% in fiscal 2025. Revenue over the same stretch went from $17.9 billion to $27.4 billion. For five years, Eaton got bigger and better at the same time. In 2026 it is getting bigger and slightly worse, which is a different proposition, and one the trailing multiple does not distinguish.
Fiscal 2025 was still a good year: net profit of $4.1 billion, up from $3.8 billion, and a net margin of 15%. Four quarters of 2025 and 2026 EPS sum to $9.83 ($2.11, $2.22, $2.91 and $2.59), which matches the $9.85 trailing figure behind the 43.1 multiple. Notice the order, though. The two weakest quarters are the two newest.
What 43 times earnings asks for
The valuation tab gives two readings. The snapshot P/E is 43.1, and the valuation series, which is computed differently, says 39.8 against a five-year average of 32.7 and a band of 27.7 to 37.7. Either way, Eaton is above the top of its own five-year range, at the 95th percentile. The industry average for specialty industrial machinery is 29.3. On the forward P/E of 29.8, the premium to that group nearly vanishes. That is the whole bull case in a sentence: the trailing multiple is high because the trailing profit is depressed, and the forward multiple is fair because analysts expect the profit to come back.
How far back? The forward P/E implies $14.23 of earnings per share, against $9.85 over the last four quarters, an increase of 45%. Put it against the most recent quarter: annualizing $2.11 gives $8.44, so the forward figure is $14.23 over $8.44, or 69% above the current run rate. I would not call that impossible for a company with a 21% sales growth rate and an electrical backlog every analyst seems to like. I would call it a lot to ask of two lines (gross margin and the below-operating items) that have been moving the wrong way.
The other multiples say much less. Price to sales is 5.1 against a five-year average of 4.3 and a forward 4.4, in the 65th percentile of its own range. Price to book is 7.5 against 5.6, the 84th percentile. Sales-based valuation is high but not extreme, which fits the idea that the market is pricing the revenue line and tolerating a weak profit line. The P/E is where the strain shows.
If you want a comparison with another stock priced on a story, Costco at 50 times earnings makes a similar argument about paying a premium multiple for a steady business. The difference is that Costco’s earnings have been rising with its price. Eaton’s have been falling while its price rose.
The demand story is real, and I am not disputing it
Reasonable people will say I am focusing on one bad quarter for a company that sits at the center of electrification. Of the $8.5 billion quarterly revenue, Electrical Americas is the largest block at 46.3%, Electrical Global adds 29.5%, Aerospace 14.3% and Mobility 9.9%. About three-quarters of the business is selling equipment into buildings and grids, and if you have read our piece on why power, not chips, is the AI bottleneck, you know why that demand is not going away soon. The same argument sits behind NextEra as a way to own the electricity demand boom. Eaton is the equipment version of that trade.
I accept the demand story. My disagreement is with the price paid for it. Demand shows up in revenue, and revenue is doing what a bull would want. What the price needs is a per-share earnings recovery, and that depends on margin and below-the-line items, which demand alone does not fix. A company can sell more and keep less of each dollar. Eaton just did.
I am also not covering the balance sheet, cash flow or the composition of the backlog here. The database gives me quarterly results, valuation, segment revenue and analyst data, so that is what this post sticks to. Anyone owning the stock should look at cash flow before drawing conclusions from EPS alone.
What the street and the tape are saying
| Metric | Value | Context |
|---|---|---|
| Price (approx.) | $424.77 | 52-week range $309 to $478 |
| P/E (TTM) | 43.1x | Five-year average 32.7x |
| Price-to-sales | 5.1x | Five-year average 4.3x |
| Analyst ratings | 100% buy, 0% hold | 10 analysts; average target $510 |
| Dividend yield | 1.01% |
Ten analysts cover Eaton and all ten say Buy. The average target is $510, 20% above the price, with a range of $487 to $534. Even the lowest target is 15% above the current price. On September 8, UBS upgraded the stock to Buy and raised its target to $515, and Bernstein’s $534 target sets the top of the range. When every rating is Buy and the low target sits 15% above the price, the consensus has nothing left to upgrade. The information in the number is small, since a unanimous group cannot get more bullish.
The stock’s reaction to the report told a different story. After the July 31 release, Eaton rose +7.3% the next day, even with EPS down 15.9%. In the three prior reports, the one-day moves were -2.7%, +0.9% and -2.3%, and the average move around earnings is 3.3%. So the July reaction was more than double the average and in the opposite direction from the EPS headline. I read that as investors weighting the 21.4% sales growth over the profit line. Our data has no guidance detail or news attribution, so I cannot say what drove it.
Elsewhere, the quantitative rating moved from D to C over the past week (48 on our scale on September 20, after 46 on September 14), the short interest was 1.9% of float on August 31, and the dividend yield is 1.01%, from $4.28 paid over the last twelve months, about 43% of trailing EPS. None of that changes the picture. Short sellers are not betting against Eaton, and it is not an income stock.
Where I could be wrong
The strongest counter-case is simple: the profit dip is temporary and the market is looking through it. That has happened before with industrial companies that were absorbing acquisitions or investing ahead of demand, and a stock that rises +7.3% on a report with falling EPS is, at minimum, telling you that some investors have more information than the EPS line. If gross margin stabilizes near 36% and the below-operating charges shrink back toward the $274 million of a year ago, EPS would rebound quickly, because revenue is now large enough that a recovery on a bigger base would show up in the per-share number.
The counter-case fails in one specific way. If the September quarter shows sales still growing above 15% and EPS still below the $2.59 of last year’s September quarter, then two quarters of falling EPS will have become three, and the forward multiple of 29.8 will rest on estimates the company has not met. At that point the 95th-percentile trailing multiple stops being a curiosity and becomes the main risk.
The scenario is not dramatic. A stock at 11.1% below its high does not need a crash to disappoint. It needs $14.23 to keep looking like next year’s number rather than this year’s.
The net income line I would hold it to
Sales growth is already in the price, so I would ignore it in the next report and read two other lines. First, net profit: it was $823 million in June, and it needs to turn back above the $1.0 billion the company earned in the September 2025 quarter. Second, gross margin: it needs to stop at 36% or better. If both hold in the next report, I would call the June quarter a pause. If net profit is still under $900 million with sales up mid-teens again, I would treat the 43.1 multiple as unsupported until the third line turns.
Financial disclaimer: The content on StockVane is for educational and informational purposes only and should not be construed as professional financial advice. Stock market investing involves risk of loss.
Sources: Dividends (SEC Investor.gov glossary) (https://www.investor.gov/introduction-investing/investing-basics/glossary/dividend) · Dividends tax topic (IRS) (https://www.irs.gov/taxtopics/tc404)