
Buy General Motors at $82.20 and analysts say you are paying 7.1 times next year’s earnings. Look at the same stock through the last four reported quarters and you are paying 36.7 times. One share, one price, two multiples that sit 30 turns apart.
Each number silently assumes something. The forward figure assumes GM earns about $11.64 a share, which is 420% more than the $2.24 it earned over the trailing twelve months. The trailing figure assumes the recent past is the run rate. My view is that neither is right as stated: the trailing multiple is inflated by one bad quarter, and the forward multiple asks for a recovery that no year in GM’s recent record supports.
What the trailing 36.7 is made of
Trailing P/E divides the price by the diluted earnings per share of the last four quarters. For GM those quarters, oldest to newest, were $1.35, a loss of $3.42, $2.82 and $1.41. They add up to $2.16. The fourth quarter of 2025 is the whole story: a $3.42 loss per share, following a $1.40 loss in the fourth quarter of 2024. Take that one quarter out and the other three sum to $5.58.
Two small notes on the data before going on. StockVane’s quote snapshot shows a trailing P/E of 36.7, which implies earnings of $2.24. The valuation tab shows 38.2, and dividing the price by the $2.16 sum gives 38.1. The gap is a matter of which earnings figure and which day feeds each display, and it does not change the argument.
Against its own history, the trailing multiple is an outlier. The five-year average is 9.6, and the current reading is in the 98th percentile of its range. The Auto Manufacturers group averages 52.0, which sounds like a comfort until you look at what drives it: a handful of automakers priced on future technology lift the group, while the group’s ordinary members trade in single digits. Comparing GM with that 52.0 tells you very little about GM.
The forward 7.1 is doing the opposite work
Forward P/E is price divided by analysts’ expected earnings. Analysts generally forecast adjusted earnings that leave out items the company classifies as special. At $82.20 and 7.1 times, the implied figure is $11.64 a share.
Turn that into dollars for the whole company. With a market value of $72.1 billion, GM has roughly 877 million shares outstanding, so $11.64 a share is about $10.2 billion of profit. This is my arithmetic from the DB market value and the analyst-implied EPS, not a company guidance number.
Now set it against what the statements show.
| Period | Net income | Diluted EPS |
|---|---|---|
| Fiscal 2021 | $9.95 billion | $6.70 |
| Fiscal 2022 | $9.71 billion | $6.13 |
| Fiscal 2023 | $9.84 billion | $7.32 |
| Fiscal 2024 | $5.96 billion | $6.37 |
| Fiscal 2025 | $2.78 billion | $3.27 |
| Implied by 7.1x forward P/E | about $10.2 billion | $11.64 |
The implied $10.2 billion would beat every year in that table, including the 2021 peak of $9.95 billion. Per share, $11.64 compares with a best of $7.32 in fiscal 2023. And it would arrive after a year in which net income was $2.8 billion and operating income was $2.9 billion, down from $12.78 billion in fiscal 2024.
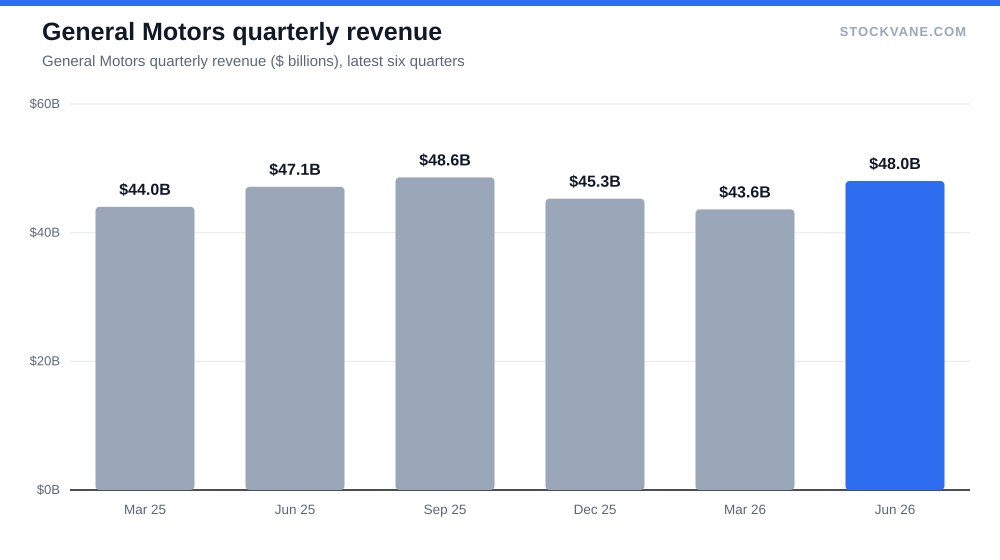
Revenue does not obviously deliver that. Fiscal 2025 sales were $185.0 billion, a decline of about 1% from $187.4 billion, and the latest quarter came in at $48.0 billion, up 2% on a year earlier. At a run rate of $192.1 billion, $10.2 billion would mean a net margin near 5.3%, against 2% last year. The margin would have to more than double on flat sales.
Where the margin went
The gross margin fell from 12.5% in fiscal 2024 to 6.3% in fiscal 2025, roughly halving. EBIT margin in the DB went from 5.0% to 2.1% over the same two years. The financials tab has the full run.
I do not have news items in the DB that attribute the drop to any specific charge, so I will not pin it on one. What the numbers do show is that a year with almost no revenue change produced a more than fourfold fall in operating income. That is the pattern of a business with high fixed costs and thin spreads, where a small change in price or cost moves the result a long way. It cuts in both directions, which is the reason the forward estimate is not absurd. If the margin recovers, the profit recovery is steep.
Where does the revenue come from? In the second quarter of 2026 the North American unit produced 83% of segment revenue, the financing arm about 9% and international operations about 8%. The recovery case is a North American case, and if it is not visible in that segment it is not happening.
Splitting the difference
I do not want to leave this at “the truth is in the middle”, which is what people say when they have not done the arithmetic. So here is a rough middle, with the assumption stated.
Suppose the $3.42 loss quarter had instead earned the average of the other three, $1.86. The four quarters would then sum to $7.44, and the price of $82.20 would be 11.0 times that. This is a normalization of my own construction, and it is generous, since the three good quarters were themselves lower than the 2023 and 2024 pace. But it puts a defensible number on a company whose loss quarters are sometimes one-off and sometimes not.
Eleven times sits a little above the five-year trailing average of 9.6. That is the fair reading: on normalized earnings GM trades near its own history rather than at a deep discount. The forward 7.1 is the number that makes it look cheap, and it depends on a year of earnings that GM has not yet produced.
Other valuation gauges disagree with the P/E. Price to sales is 0.4, right at the five-year average of 0.4. Price to book is 1.2 against an average of 0.9, in the 88th percentile of its band. On assets and sales the stock is priced ordinarily, and only on earnings does it look distorted, which is what you would expect when earnings are the most volatile input.
What the market and analysts are telling us
Sixteen analysts cover the stock, and 94% rate it a buy, with none at hold and about 6% at sell. The average target is $107, 30% above the price, in a range from $61 to $132. The low end is 26% below the current price and the high end 61% above it. A group that is nearly unanimous and still spans $61 to $132 is not sure what GM earns. That spread is the forward-versus-trailing question restated in target-price form.
The stock’s reaction to results has been friendly lately. After the last four reports the one-day moves were +4.9%, +1.3%, +8.7% and +14.9%, newest first, with an average absolute move of 7.4%. Four gains in a row is a streak that tells you the market has been leaning toward the recovery story. It also means expectations have been raised, and a fifth report that merely meets them could disappoint. The stock is 10.3% below its 52-week high of $92 and 53% above the low of $54, a good part of the rebound is already in the price.
Short interest is 2.5% of the float, or about four days of average volume, which is not a crowded bet in either direction. The quant score in StockVane data moved from C to B over the last few weeks. I treat that as a description of recent momentum and not a forecast.
Dividend investors should note the yield is 0.80%, from $0.66 paid over the last twelve months. That is a token payout next to what the earnings story implies, and it leaves the return case with the share price. For an example of how a different kind of company gets a different multiple, Costco at 50 times earnings sits at the other end of the scale from GM at 7, and JPMorgan at 15 times sits between them.
What would prove me wrong
The third-quarter report is due on October 20. It will not remove the $3.42 loss from the trailing window; that quarter stays until the fourth-quarter report. What it replaces is the $1.35 earned in the third quarter of 2025. So the trailing multiple can only move a little on that date, and the signal is in the direction of the quarter.
I would be wrong on the cautious side if diluted EPS comes in near $2.90, the level of the first quarter of 2026, with a gross margin back above 10%. The four-quarter total would then be about $3.71 and the trailing multiple near 22, and analysts’ $11.64 would look like an ordinary rebound. I would then concede the loss quarters were one-offs.
I would be wrong on the generous side if the quarter lands at or below last year’s $1.35 while the gross margin stays near 6%. Then my normalization fails, the 36.7 was a fair price for a lower-earning company, and the forward 7.1 is a mirage.
The Q3 figure that decides it
One number, October 20: diluted EPS against $1.35. Above $2.50 and I start believing the forward estimate. Below $1.35 and I stop pretending the loss quarter was the only problem.
Financial disclaimer: The content on StockVane is for educational and informational purposes only and should not be construed as professional financial advice. Stock market investing involves risk of loss.
Sources: Dividends (SEC Investor.gov glossary) (https://www.investor.gov/introduction-investing/investing-basics/glossary/dividend) · Dividends tax topic (IRS) (https://www.irs.gov/taxtopics/tc404)