
Emerson’s operating income rose 32% in fiscal 2025, from $2.67 billion to $3.53 billion, on revenue growth of just 3%. Profit grew ten times faster than sales. That single fact is the best argument for owning the stock at $150, and it is the reason the multiple has moved where it has.
The multiple is 32.8 times trailing earnings. Emerson’s own five-year average is 21.2, so the stock trades at 1.55 times its history, or 55% above it. Specialty industrial machinery companies as a group sit at 30.2, which means the premium to peers is small and the premium to Emerson’s own past is large.
Our reading is that the price already assumes the margin gains hold and the growth rate keeps improving. Both are plausible on the June-quarter figures. Neither is guaranteed, and the gap between $150 and what the stock fetched at its old multiple is wide enough to matter.
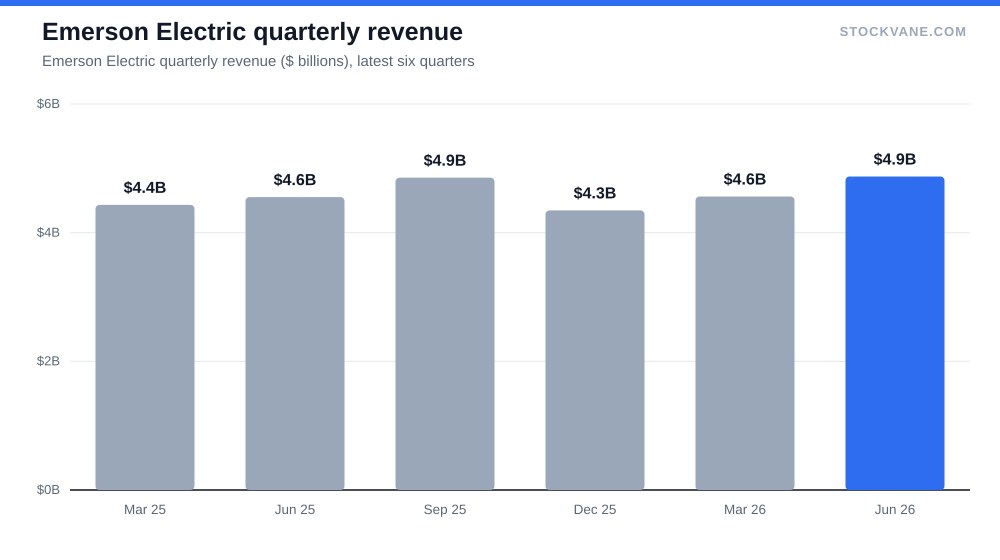
What the 32% jump in operating income was made of
Gross margin tells the story. It was 41.7% in fiscal 2022, 49.0% in 2023, 50.8% in 2024 and 52.8% in 2025. Emerson keeps about eleven more cents of every revenue dollar after production costs than it did three years ago. The operating margin, computed as operating income over revenue, reached 20% in 2025. The database’s EBIT margin for the same year is 18.4%, a definitional difference in what is counted as operating; we use the 20% figure when we discuss the income statement and the EBIT figure only when we compare against the earlier years in the same series.
Note the earlier years in that series. EBIT margin was 22.0% in fiscal 2022, 19.7% in 2023 and 13.4% in 2024, before recovering to 18.4%. The 2024 dip did not come from operations. Revenue grew 15% that year and gross margin rose. Something below the gross line consumed the improvement, and we cannot say what from the data we hold. The clean reading is that the 2025 margin is a recovery to the 2022 neighborhood, not a new peak.
Revenue is a different matter. Sales were $13.8 billion in fiscal 2022 and $18.0 billion in 2025. That is a 31% gain over three years, but the last step was the smallest: 10% in 2023, 15% in 2024, then 3%. Emerson’s growth rate slowed to a crawl exactly as its margin recovered, which is a reasonable place to be for a company managing its portfolio. It is a poor place to be for a stock priced at more than 30 times earnings.
The quarter that changed the direction
The fiscal third quarter, which ended in June, is the reason the debate is live. Anyone reading it should follow the routine in our guide to reading an earnings report: set the growth rate and the margin against the prior four quarters before trusting either. Revenue was $4.9 billion, up 7% from a year earlier. The preceding quarters in our database grew 5%, 4% and 3%, so the June figure is the fastest of the run. Diluted EPS for the quarter was $1.28, up 23.1%.
Annualize that quarter and the revenue run-rate is $19.5 billion, roughly 8% above fiscal 2025. That is arithmetic, not a forecast, and seasonality can move it. But it says the top line has stopped decelerating.
By segment, the quarter was led by Final Control at $1.59 billion, about 32.5% of the total. Control Systems and Software followed at $1.20 billion (24.6%), Sensors at $1.09 billion (22.4%), Safety and Productivity at $552 million (11.3%) and Test and Measurement at $445 million (9.1%). Two segments, Final Control and Control Systems and Software, account for 57% of revenue. Any judgment on Emerson is largely a judgment on those two.
Take the stock’s reaction in context. After the August 4 report the shares gained +2.3% in a day. That is below the 4.1% average one-day move after the last four reports, which ran +2.3%, +6.9%, +3.4% and -3.8%, newest first. The market liked the quarter and did not treat it as a surprise.
What 32.8 times buys and what 27.2 times buys
Trailing earnings per share, the base for the 32.8, are $4.57. Analysts’ forward estimate is $5.52, which implies 21% growth over the next twelve months, and puts the forward multiple at 27.2. So the market is paying 27.2 times for a year in which profit is expected to grow by a fifth.
That growth is the whole case. If it arrives, the multiple compresses to 27.2 without the price moving, and the stock looks less stretched than the trailing figure suggests. If it arrives at half the pace, the forward multiple is closer to 30 and the premium to the group returns.
Compare it with what the old multiple would give. Apply the five-year average of 21.2 to trailing earnings and you get $97. Apply it to the forward estimate and you get $117. Both are far below $150. The same habit of asking what a multiple assumes shows up in Costco at 50 times earnings, where the premium is far bigger. Investors are not paying the historical price for these earnings; they are paying for a different kind of company than the one that earned the average.
There is a reason to be careful about that average, though. Emerson’s reported net income was $13.2 billion in fiscal 2023 against operating income of $2.76 billion. Net income cannot exceed operating income by that margin from operations; the year’s reported earnings included items outside the ongoing business. Diluted EPS that year was $22.88, against $3.43 the next year. A five-year P/E average built on such a series is noisy, and it may understate what investors historically paid for the continuing business. The 1.55 figure is a fair headline. It is a weak yardstick.
The price-to-sales ratio is cleaner. It is 4.5 against a five-year average of 3.5, in the 93rd percentile of its range, and the forward figure is 4.3. Industry average price-to-sales is 4.0. On sales, then, Emerson costs about a tenth more than its group and about a quarter more than its own history.
| Metric | Value | Context |
|---|---|---|
| Price (approx.) | $149.92 | 52-week range $122 to $166 |
| P/E (TTM) | 32.8x | Five-year average 21.2x |
| Price-to-sales | 4.5x | Five-year average 3.5x |
| Analyst ratings | 69% buy, 23% hold | 13 analysts; average target $171 |
| Dividend yield | 1.46% |
What the analysts and the tape are saying
Thirteen analysts cover the stock. Nine of them (69%) rate it a buy, three hold and one sells. The average target is $171, 14% above the price, and the range runs from $135 (-10%) to $190 (+27%). A low target below the current price is worth noticing; it says at least one analyst sees the $150 level as running ahead of the fundamentals.
Price is 9.6% below the 52-week high of $166 and 23% above the low of $122. The market value is $83.6 billion. Short interest is 1.6% of float, which is low and tells us positioning is not the story. The dividend yield is 1.46%, from $2.19 paid over the last twelve months, which is not enough to carry a valuation case on its own.
The database’s quantitative rating moved from D to C over the past forty trading days. It is a modest change, and we treat it as confirmation that the June quarter improved the measured trend, not as a reason to buy.
Set that against JPMorgan at a record high, where the stock sits at its peak on a multiple of 15. Emerson has the reverse profile: a price 10% under its high on a multiple more than twice as large. Nobody should read the two as directly comparable businesses. They show how differently the market prices confidence.
What would make this premium wrong
A premium multiple has one job: it has to shrink through earnings, not through the price. At 32.8 times the trailing figure, the arithmetic is unforgiving. Earnings of $5.52 at today’s price give 27.2 times. Earnings of $5.00, which would be growth of 9% instead of 21%, give about 30 times. Earnings of $4.57, no growth at all, leave the multiple exactly where it is and the price waiting for someone else to raise the bid.
The risk is concrete. If the June quarter’s 7% revenue growth falls back to the 3% to 5% range of the three quarters before it, the forward estimate of $5.52 depends almost entirely on margin gains, and margin gains have limits. Gross margin is already 52.8%, up from 41.7% in 2022; each additional point is harder to find than the last.
The second risk sits in the same data. The 2024 dip in EBIT margin to 13.4% showed that a year of revenue growth and rising gross margin can still produce falling operating profit. Whatever caused it, nothing in the current figures rules out a repeat.
We are not covering the company’s acquisitions or divestitures, its order backlog or its cash flow here. Those figures are not in the data behind this note, and a valuation argument that leans on them without evidence would be a guess.
The June-quarter EPS I would want repeated
The number is $1.28. Repeat it, or improve on it, in the fiscal fourth quarter and the 21% growth built into the forward estimate looks achievable. If quarterly diluted EPS drops below roughly $1.20 while revenue growth slips under 5%, the stock’s case for a forward multiple of 27.2 weakens quickly, and the 32.8 trailing figure will stop looking like a temporary reading of a recovery. Until then, we would call Emerson a good business with the improvement mostly in the price.
Financial disclaimer: The content on StockVane is for educational and informational purposes only and should not be construed as professional financial advice. Stock market investing involves risk of loss.
Sources: Dividends (SEC Investor.gov glossary) (https://www.investor.gov/introduction-investing/investing-basics/glossary/dividend) · Dividends tax topic (IRS) (https://www.irs.gov/taxtopics/tc404)