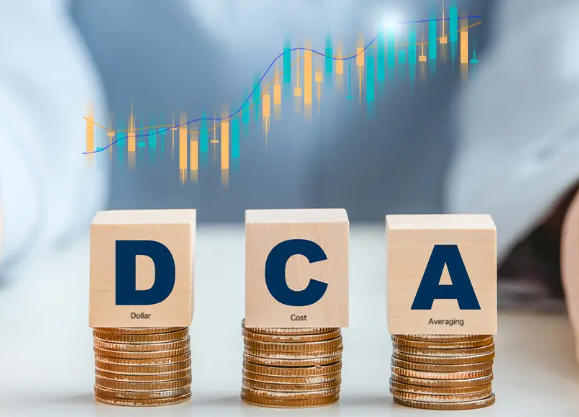
Dollar Cost Averaging Calculator
$1,200 spread across a dip and a recovery buys 12.33 shares versus 12 for a lump sum. Our dollar-cost averaging calculator projects your balance, plus why lump-sum investing usually wins on paper and DCA wins…
Every number on this page is something you can actually test before it costs you money. That’s the whole idea behind this section — a working set of calculators for the math that actually matters when you’re building a position, sizing a trade, or figuring out whether a strategy holds up once you run real numbers through it instead of gut-checking it.
I built these because I got tired of doing the same napkin math over and over — how much compounding actually adds over 20 years versus 10, what a 2% risk limit means in actual share count, what a covered call really nets after the stock gets called away. None of it is complicated math. Most of it is arithmetic anyone learned in high school. But doing it by hand every time you want to test an assumption gets old fast, and spreadsheets have a way of accumulating errors nobody catches until the numbers stop making sense.
So these are stripped down to just the inputs that matter. No sign-up, no data collection, nothing running in the background — you type in numbers, you get an answer, and if you change your mind about an assumption you just change the number and run it again. A few of them cover ground that overlaps (compounding shows up in both the DCA calculator and the dividend reinvestment one, for instance), which is intentional — different questions call for different framing even when the underlying math rhymes.
Use these as a sanity check, not a forecast. A calculator can tell you what a 7% return compounds to. It can’t tell you whether 7% is the right assumption for your portfolio, and neither can I — that part’s still on you.

$1,200 spread across a dip and a recovery buys 12.33 shares versus 12 for a lump sum. Our dollar-cost averaging calculator projects your balance, plus why lump-sum investing usually wins on paper and DCA wins…
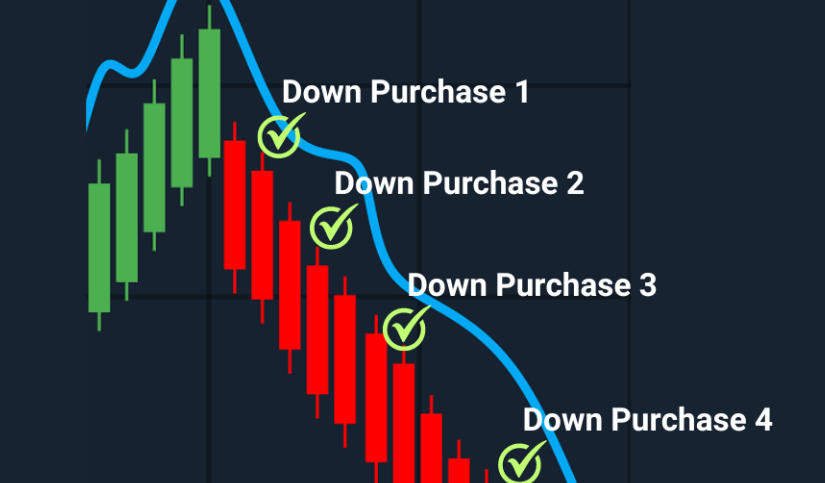
Two lots, two prices, one blended cost basis. Our free stock average calculator finds your true break-even and unrealized P&L, plus the three mistakes that make investors misjudge how far a position actually has to…
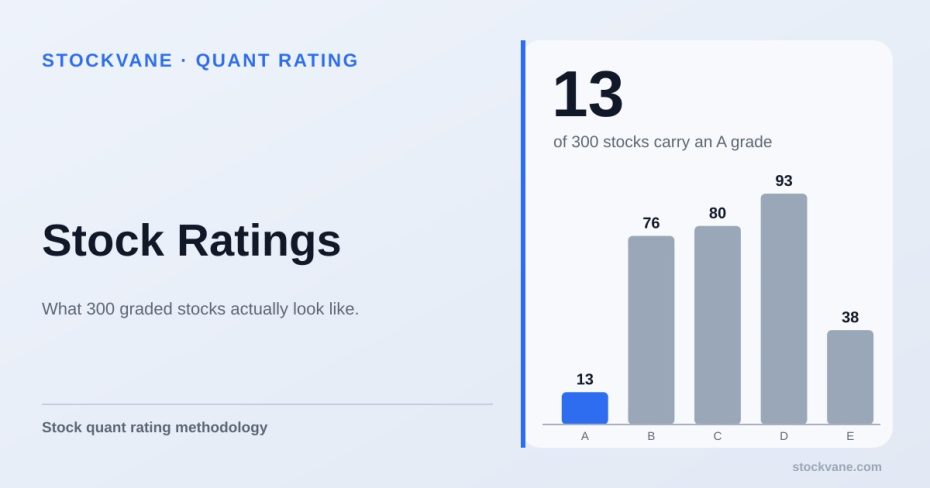
Of 300 rated stocks, only 13 carry an A grade while 93 carry a D, the largest bucket. Two names, Vertiv and Vale, hold D grades despite scores of 89 and 71 that would read…
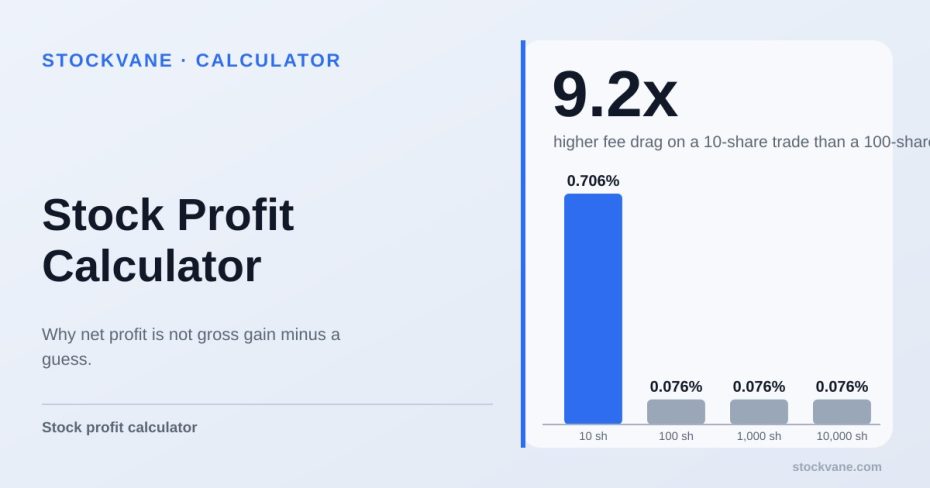
A $1,000 gross gain on 100 shares nets $999.24 after real commissions and SEC/FINRA fees, a 0.08% drag. Drop to 10 shares and the same fee schedule costs 0.71%, nine times more, because the broker’s…
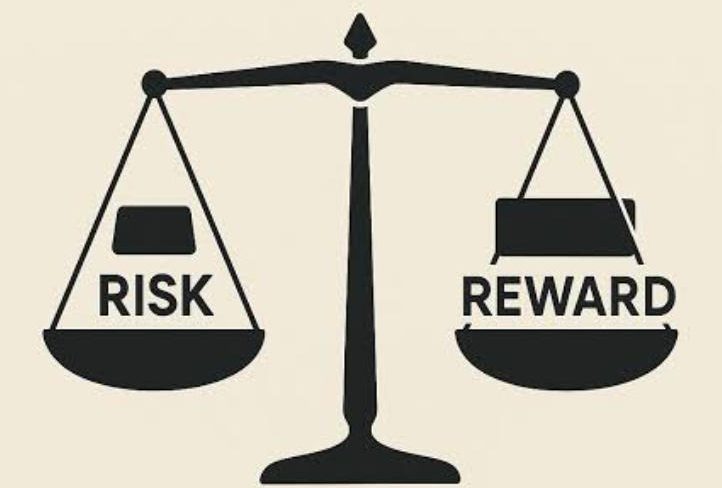
A 1:1 risk-reward ratio needs a 50% win rate just to break even, before commissions. This calculator turns entry, stop and target into the ratio, the breakeven win rate, expectancy per trade, and where most…

Position size, not entry price, is what actually blows up retail accounts. This calculator turns your account size, risk tolerance, and stop distance into a share count, plus the mistakes that quietly turn a planned…
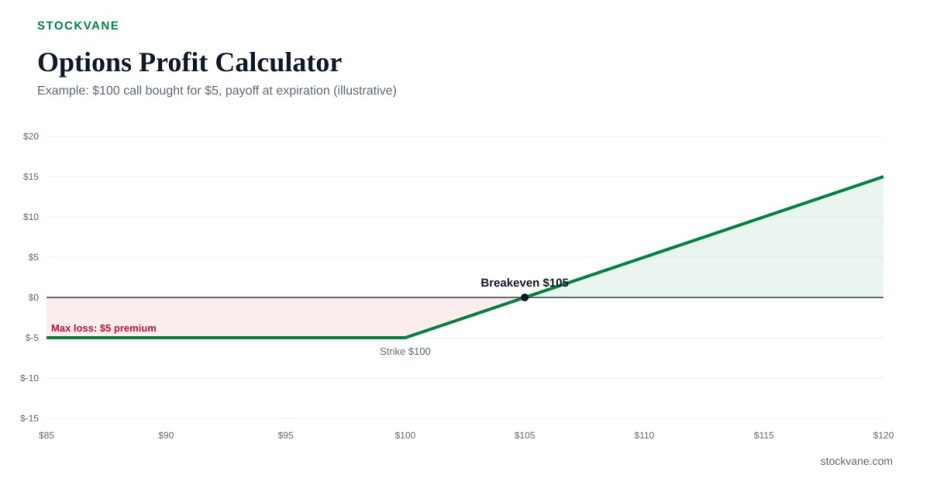
A $100 call bought for $5 needs the stock above $105, not $100, to turn a profit. Our free options profit calculator charts the payoff curve for all six core strategies, plus where breakeven, assignment…
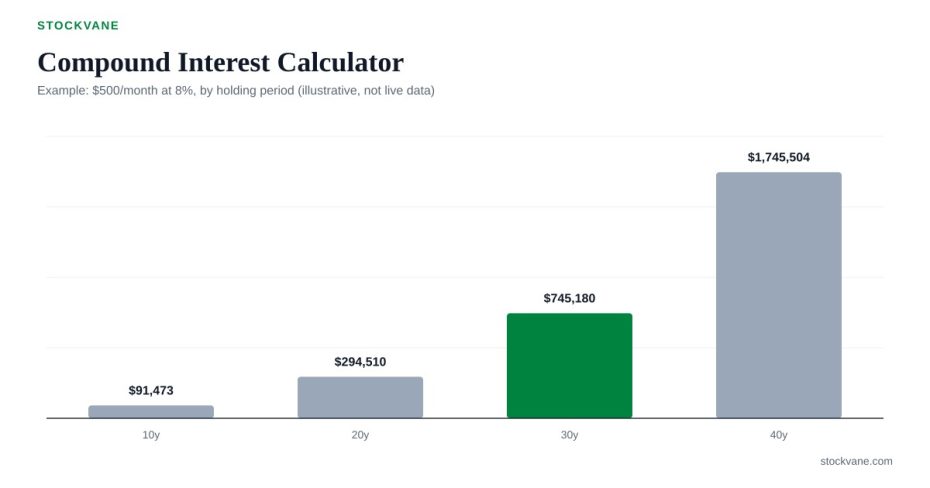
A $500 monthly habit started ten years late costs $450,670 by year thirty. Here is the compounding math behind that gap, why monthly beats annual compounding by $8,731, and how a one-point return assumption swings…