
In 2022 Goldman Sachs revenue fell 20%, from $59.34 billion to $47.37 billion. Net income fell 48%, from $21.64 billion to $11.26 billion. That gap between a modest revenue decline and a brutal profit decline is the whole argument for treating a record-high bank stock with suspicion.
Today the stock is not quite at a record. It closed at $942, 18.0% below its 52-week high of $1,148, on a trailing P/E of 14.5. The high is behind it, and the question I want to answer is what the next downturn in trading and dealmaking does to a stock that earns $64.76 a share on the way up. My view: at 14.5 times earnings, Goldman is priced as if the good run repeats, and the valuation tab shows the price-to-book multiple has already moved outside its five-year range.
What the last four years say about earnings quality
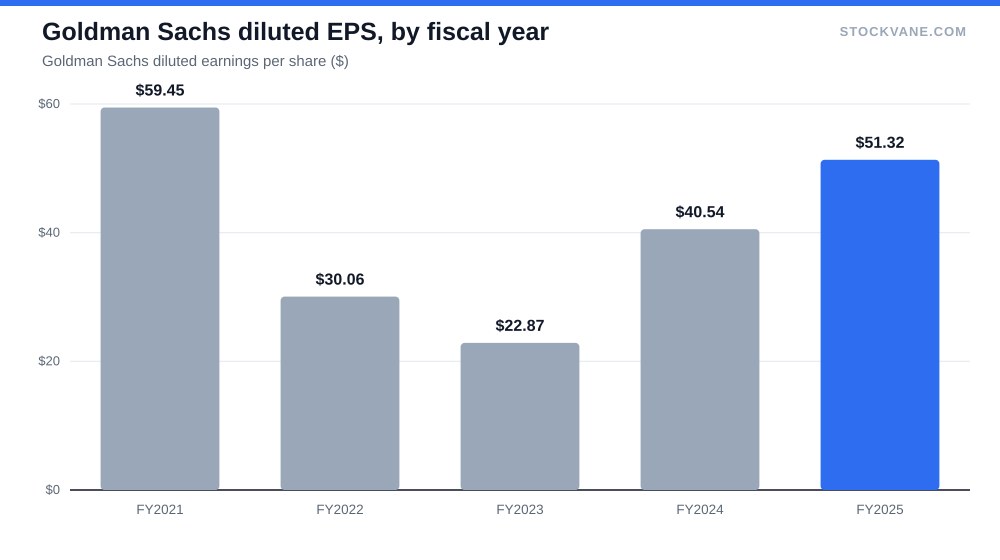
Revenue tells you less than profit at a firm like this. Between 2021 and 2025, Goldman’s revenue went from $59.34 billion to $58.3 billion, a decline of about 2% over four years. Net income went from $21.64 billion to $17.2 billion, roughly 21% lower. Diluted EPS went from $59.45 to $51.32. The revenue line is back near its 2021 peak. The profit line is not.
Two things explain the difference, and only one of them is bad news. The bad news is the fixed cost base. When trading desks and advisory teams book less, compensation does not fall one for one, and the fixed cost base of a global bank stays put. That is how a 20% revenue slide in 2022 became a 48% net income slide, and how a 2% revenue slide in 2023 (to $46.25 billion) became a further 24% drop, to $8.52 billion. I read the 2022 to 2023 pair as the best available stress test in the data: two years, revenue down about 22% from the peak, net income down 61%.
The better news is that the recovery ran the same mechanics in reverse. Revenue rose 16% in 2024 and net income rose 68%. In 2025, revenue rose 9% and net income rose 20%. The fixed costs that hurt on the way down flatter profit on the way up, and the past two years have been the good direction. It is also why the multiple on peak-ish earnings deserves a haircut.
The most recent quarter is the strongest print in the series. Revenue reached $20.3 billion, up 39% from a year earlier and 18% from the prior quarter. Multiply by four and you get an annualized run rate of $81.4 billion, about 40% above the 2025 total. Run rates flatter, of course, because trading revenue does not arrive in equal quarters. Still, a single quarter that large tells you the second half of the year starts from a high base.
Where the revenue comes from
The segment split for the June quarter is the reason the cyclical worry is not a dismissal. Global Banking and Markets, the trading and investment banking engine, produced $15.52 billion, or 76.3% of revenue. Asset and Wealth Management produced $4.60 billion, or 22.6%. Platform Solutions, what is left of the consumer push, contributed $221 million, or 1.1%.
So roughly three dollars in four still come from the most cyclical part of the firm. Management has spent years trying to raise the fee-based share, and 22.6% is a real business, but it does not change the math on a bad year. If asset and wealth revenue held flat while the markets segment dropped 25%, total revenue would fall by roughly 19%, close to the 2022 decline. The fee business cushions, and it does not offset.
I would compare Goldman with JPMorgan here, since the two are the usual pair. JPMorgan at a record high makes the case that a bank with consumer deposits and card income can carry a similar multiple with less earnings volatility. Goldman lacks that ballast: it has no large retail deposit base to smooth a quarter in which clients stop trading and companies postpone deals, so its earnings lean on capital markets activity far more than a universal bank’s do. The market is charging a lower multiple for it in some frames and a higher one in others, which brings us to valuation.
Three gauges, three different answers
Price to earnings looks fine. The trailing figure is 14.5. On the valuation history, the current reading of 15.3 sits against a five-year average of 13.3, at about the 51st percentile of its own range. Forward P/E is 13.8, using analyst EPS of $68.23. Against an industry average of 18.2 that looks cheap.
Price to book does not look fine. It is 2.6 against a five-year average of 1.5, and the five-year band runs only from 1.0 to 2.1. The stock is above the top of that band, at about the 94th percentile. Price to sales is 4.3 against 3.0, at the 86th percentile, with the band topping out at 4.0.
Why do the gauges disagree? Because earnings are at a high while book value and sales have grown more slowly. A P/E at the middle of its range on earnings that sit above the long-run trend is not a middle-of-the-range valuation. I read it this way: the P/E is low because the E is high, and the P/B and P/S are the numbers telling you where in the cycle you are buying.
One more oddity. The forward EPS of $68.23 is only about 5% above the trailing $64.76, even though last quarter’s revenue ran 39% ahead of the prior year. Either analysts are still catching up to the quarter, or they treat it as close to a peak. I do not know which. The stale-estimate reading would be bullish, and the peak reading would not be, and the only way to tell is the October report.
Stress arithmetic, not a forecast
Take the trailing EPS of $64.76 and apply the 2022 damage. Diluted EPS fell 49% that year, from $59.45 to $30.06. Do that today and EPS becomes about $33.03. Hold the multiple at 14.5 and the stock is worth about $480, a 49% decline from $942. That is the rough scale of the exposure if a full repeat arrives and the market keeps paying the same multiple.
A milder repeat, like 2023’s 24% EPS decline, gives about $49.22 a share. Nothing here says it will happen. I am pointing out the shape: the stock has fallen 18% from its high without any of these declines yet arriving in the reported numbers, and the earnings reactions on the way up have been large. The last report, on 2026-07-14, moved the stock +9.0%, against an average earnings-day move of 4.4%.
What the other side says
The counter-case is not weak. Thirteen analysts cover the stock, and the average target is $1,203, 28% above the current price. The lowest target, $1,075, is still 14% above it, and the highest, $1,325, is 41% above. Only 46% rate it a buy, though, and 46% say hold. Even the optimists are not the whole street. And a floor target 14% above the market usually reflects targets that have not been updated after a sell-off.
The dividend is a small consolation: 1.80% on $17.00 paid over the last twelve months. Short interest is 2.4% of float, so nobody is betting hard against it. Our quant screen scores the stock a D, unchanged from two weeks ago. That rating leans on momentum and valuation, and it does not know about the June quarter, so I would not lean on it.
I am not covering the regulatory capital picture or the details of the firm’s private-markets exposure. The database holds neither, and I would rather leave them out than guess.
What the macro backdrop adds
Capital markets revenue follows the calendar of volatility and deal completions. The Fed’s September 16 hike matters less as a rate move than as a signal for how many deals get done in the next two quarters: higher rates raise the cost of financing and can slow underwriting and M&A. Geopolitical shocks, which we covered in the Iran-Israel war piece, cut the other way, though they also lift trading volumes. Goldman earns from both, which is why the stock has historically not fallen in a straight line.
| Metric | Value | Context |
|---|---|---|
| Price (approx.) | $942.00 | 52-week range $726 to $1,148 |
| P/E (TTM) | 14.5x | Five-year average 13.3x |
| Price-to-sales | 4.3x | Five-year average 3.0x |
| Analyst ratings | 46% buy, 46% hold | 13 analysts; average target $1,203 |
| Dividend yield | 1.80% |
The revenue line I would not accept on October 13
The third-quarter report arrives on 2026-10-13. The June quarter set a $20.34 billion bar, so the test is not whether Goldman beats last year, which is nearly guaranteed against a much weaker base. The test is whether revenue holds above roughly $18 billion, which is the level of the March quarter’s $17.23 billion plus a bit of momentum, and whether the markets segment stays above 75% of the total without the fee segment slipping under $4.5 billion.
If revenue falls back below $17 billion, I would treat the stress arithmetic above as the live scenario, and $942 would no longer look like a margin of safety. If it holds above $19 billion, the forward EPS of $68.23 is stale, and the case for a P/E near 14 becomes easy to defend.
Financial disclaimer: The content on StockVane is for educational and informational purposes only and should not be construed as professional financial advice. Stock market investing involves risk of loss.
Sources: Dividends (SEC Investor.gov glossary) (https://www.investor.gov/introduction-investing/investing-basics/glossary/dividend) · Dividends tax topic (IRS) (https://www.irs.gov/taxtopics/tc404)