
The headline on this page says the Fed cuts on September 16. It did not. A headline in our news feed dated September 17 reads “Fed Delivers Its First Hike in 3 Years,” and the closing wrap the same day says the dot plot hints at another hike this year, which sent stock indexes lower for a third straight session. I wrote this piece on September 10 assuming a quarter-point cut. I had the direction wrong. What I did not get wrong is the argument in the second half of the title, and this rewrite is about why.
The argument was that the decision is the smallest part of a Fed day. What matters is why the Fed moved and what it says it will do next. Swap the word “cut” for “hike” and the framework survives intact. It also handles the case I underweighted: a central bank that tightens because the economy is running too hot, and inflation is not finished.
What the data did before the meeting
Reading it back, the evidence was on the screen. On September 4, the August payrolls report beat expectations by enough that a feed headline called it support for bets on a rate hike. A week later, on September 11, our news feed showed Treasury yields approaching the 5% mark, oil above $100 and an August inflation report that Dow Jones summarized the next afternoon as a firm reading pushing the Fed closer to a rate increase. A separate headline that day quoted a mentor of Treasury Secretary Bessent saying rate cuts were no longer necessary.
None of that fits a cut. A trader reading the same feed would have moved the odds well before Wednesday, and a reader who watched only the futures would not have seen why. Earlier in the month, a dovish comment from one Fed official had rallied stocks and bonds, and an HSBC note on September 4 expected the funds rate to stay in its 3.5% to 3.75% range for two years. Both readings were reasonable in early September, and the data shifted underneath them within a week. That is the lesson of the whole episode: I anchored on the market’s expectation of a cut rather than on what the inflation and jobs prints were saying, and I should have checked how quickly a single hot number can move a Fed meeting from a cut to a hold to a hike. Consensus for a Fed meeting is often right. It is never a fact.
Three kinds of first move, not two
The pattern is worth spelling out, because the sequence of prints matters as much as the level. Payrolls came first, then the inflation report, then the meeting. Each one made the next one harder to read as a soft-landing story.
The old version of this article split history in two. A soft-landing cut, like 1995 and 2019, is followed by a good year for stocks. A cut because something is breaking, like 2001 and 2007, is a warning. I would keep that split for cuts, and add a third row for what actually happened: a hike into strength, made because inflation is not yet beaten.
That third kind is harder to read, because the message is mixed by design. A hike says the economy can take tighter policy, which is a compliment. It also says the price of money for every company and household just went up, which is a cost. Which effect wins depends on whether the market believes the Fed is done. The dot plot answered that: one more hike indicated for this year. That is why stocks fell for three sessions in a row.
The Fed cutting for the wrong reasons is a warning. The Fed hiking for the right reasons is a bill.
How far the market has slipped
The cleanest measure I have is distance from the 52-week high, because it does not depend on picking a start date. As of September 18, the S&P 500 fund SPY is 2.0% below its high of $777.44. The Nasdaq-100 fund QQQ is 3.5% below, the Dow fund DIA is 5.4% below, and the small-cap fund IWM is 6.7% below.
The ordering is the story. Rate hikes hurt small caps most, and here they sit furthest from their high. Small companies borrow more at floating rates, so a higher funds rate hits their interest bill directly, and in the old version I noted that approximately 40% of small-cap debt is floating-rate. The Nasdaq-100 is nearer its peak than the Dow, which I read as investors still leaning on large tech balance sheets. Anyone holding the triple-exposure fund I covered in the TQQQ risk-reward breakdown feels swings in the index at roughly three times the size, so a fourth down session would show up there fast. Nothing here looks like a rout. SPY is still 22% above its 52-week low of $626.11, and IWM is 25% above its low of $226.60. This is a pullback inside a rally, and the size of the gap that remains tells you how much is still priced for a gentle path.
The sector playbook, redone
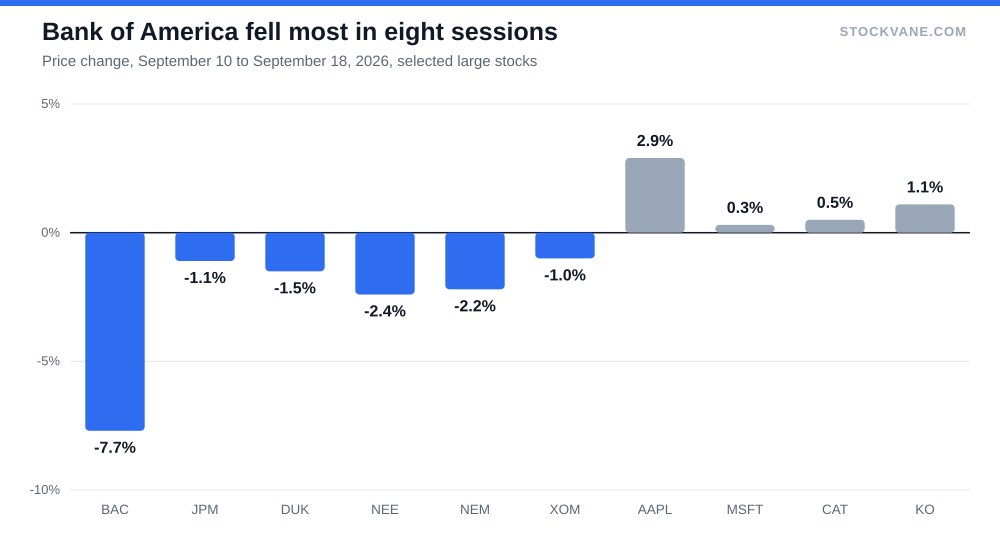
Here is how a basket of large names moved between the close on September 10, the day this article first ran, and the close on September 18.
| Stock | Group | Close Sep 10 | Close Sep 18 | Change |
|---|---|---|---|---|
| Bank of America (BAC) | Banks | $62.56 | $57.73 | -7.7% |
| JPMorgan (JPM) | Banks | $353.56 | $349.67 | -1.1% |
| Duke Energy (DUK) | Utilities | $119.37 | $117.53 | -1.5% |
| NextEra Energy (NEE) | Utilities | $82.44 | $80.47 | -2.4% |
| Newmont (NEM) | Gold miners | $126.14 | $123.41 | -2.2% |
| Exxon Mobil (XOM) | Energy | $165.23 | $163.54 | -1.0% |
| Apple (AAPL) | Large-cap tech | $326.57 | $336.13 | +2.9% |
| Microsoft (MSFT) | Large-cap tech | $492.44 | $493.78 | +0.3% |
| Caterpillar (CAT) | Industrials | $805.00 | $808.99 | +0.5% |
| Coca-Cola (KO) | Staples | $87.31 | $88.25 | +1.1% |
Banks did worst. Bank of America dropped 7.7%, while JPMorgan lost only 1.1%. A hike does not automatically help lenders: higher rates lift what banks earn on loans but also raise deposit costs and credit worries, and the market clearly leaned toward the second reading during these eight sessions. I wrote in the earlier version that regional banks would trade on loan-loss provisions and commercial property exposure; nothing in this week’s prices argues against that. For a fuller look at one large bank at this point in the rate cycle, see JPMorgan at a record high, and what you are betting on at 15 times earnings, which sets its multiple against its own history.
Utilities slipped too, as bond proxies do when yields rise: NextEra lost 2.4% and Duke 1.5%. NextEra is now well below its 52-week high of $97.30, and I would not describe it as a defensive hold in a tightening. The NextEra forecast argues the electricity-demand story is separate from the rate story; the eight sessions we just saw show how far the rate story can override it in the short run.
Gold miners gave back ground with the metal. Newmont fell 2.2%, consistent with the wrap that had gold plunging as the dollar index rebounded above 100. So the trade I expected to work, gold rising as real yields fall, went the wrong way, which is what a hike does to it.
Apple, Microsoft and Coca-Cola held up. Apple rose 2.9%, Microsoft 0.3% and Coca-Cola 1.1%, and Caterpillar edged up 0.5%. Exxon lost 1.0% even with oil above $100, so the price of crude did not carry the stock; the Exxon forecast makes the case that discipline, not the oil price, is what drives that one. Eight sessions and ten names are a small sample; I treat the direction as a hint, not a rule.
What I got wrong, and what I would do differently
I framed the meeting as a coin flip between two kinds of cut, and I gave it one line of caution about the futures market. That was too casual. The right way to treat a market pricing of better than 90% is to ask what would make it wrong, and a hot jobs report plus a firm inflation reading plus oil at $100 is precisely such a list. I had all three in the feed.
The nearest thing to a defense is that my advice to the reader held. I said not to add risk to chase the cut and not to cut exposure on the chance it went badly, because timing a two-day window is a good way to be wrong twice. A reader who did that has seen SPY end up about 2% below its high, which is a small price for not guessing the direction. The defensive tilt I described held up mixed, as the table shows: utilities lost, staples gained. The win-rate list I published for September is the version of that thinking I still stand behind, though I would now lean it toward names that do not need lower rates to work.
Some things I am not covering. I have no fed funds futures data in our database, so I cannot say how much of the hike was priced in, and I will not guess. The new funds rate level is also not in our data, so I have not quoted it. Whether the September 17 headline’s “first hike in three years” reflects a quarter-point move is something to check against the Fed’s own statement.
The line I would draw at $777
The next fact that matters is not the Fed’s next meeting. It is whether SPY can get back to its 52-week high of $777.44, which is 2.0% above where it closed on the 18th. If small caps keep sliding while the S&P 500 holds within that band, the hike is being read as a sign of strength. If IWM’s gap to its high widens past 10% while SPY stays within 3%, the market is telling you the cost of money is doing its work under the surface, and I would treat a fresh SPY high with suspicion.
Financial disclaimer: The content on StockVane is for educational and informational purposes only and should not be construed as professional financial advice. Stock market investing involves risk of loss.
Sources: Dividends (SEC Investor.gov glossary) (https://www.investor.gov/introduction-investing/investing-basics/glossary/dividend) · Price-to-earnings ratio (SEC Investor.gov glossary) (https://www.investor.gov/introduction-investing/investing-basics/glossary/price-earnings-pe-ratio)