
NVIDIA is the largest company in our coverage, worth $5.4 trillion, and it ranks number 11 out of 258 on this list of the cheapest stocks against their own five-year P/E history. Its trailing P/E is 28.1. Over the past five years it has averaged 72.7.
That is the kind of result a “cheap versus history” screen produces, and it is a reason to read the screen carefully instead of trusting it. We took every stock in StockVane’s coverage with a market value of at least $55 billion and a positive trailing P/E and five-year average P/E, which leaves 258 names. We ranked each one by where today’s P/E sits inside its own five-year range, using the valuation percentile in our database, where 0 is the lowest reading in five years and 100 the highest.
My argument is that this ranking finds two different kinds of stock. Some are cheap because the price fell while earnings held up, which is a real discount. Others are cheap or expensive only because the earnings figure in the denominator is temporarily distorted, which is an accounting artifact. Telling them apart takes one extra check, the kind of step I describe in how I actually pick stocks, and I will show which of the twenty pass it.
The ten at the bottom of their own range
All ten sit below the 1st percentile, meaning their P/E is lower than it has been on almost any day in five years. A further 20 stocks fall between the 1st and 10th percentile, so the extremes are thin.
| Stock | P/E now | Five-year average | Percentile | Now vs average |
|---|---|---|---|---|
| Boston Scientific (BSX) | 17.4 | 69.0 | 0.1 | -75% |
| Aon PLC (AON) | 16.7 | 31.5 | 0.1 | -47% |
| Honeywell (HON) | 7.9 | 24.9 | 0.2 | -69% |
| Booking Holdings (BKNG) | 19.0 | 58.7 | 0.2 | -68% |
| McDonald’s (MCD) | 20.5 | 26.7 | 0.2 | -23% |
| TransDigm (TDG) | 34.6 | 48.1 | 0.2 | -28% |
| Duke Energy (DUK) | 17.7 | 26.5 | 0.3 | -33% |
| Stryker Corp (SYK) | 29.0 | 43.3 | 0.4 | -33% |
| RELX PLC (RELX) | 20.1 | 31.2 | 0.5 | -36% |
| PepsiCo (PEP) | 17.8 | 26.2 | 0.5 | -32% |
Boston Scientific tops the list on distance from its average: a P/E of 17.4 against a five-year average of 69.0. Its shares trade 59% below their 52-week high, and here the discount is genuine. Diluted EPS rose from $1.25 in 2024 to $1.94 in 2025, an increase of 55%, while the stock went the other way. Price fell, earnings rose, so the multiple compressed. That is what a real re-rating looks like, and the valuation tab for Boston Scientific shows the average was inflated by a period when earnings were tiny: 2022 EPS was $0.45.
That last point matters. A five-year average P/E of 69 is not a target the stock will ever return to. It reflects years of depressed earnings per share, when a small denominator produced a large ratio. (If you want to rank by your own rules, StockVane’s analysis tool lets you set the scoring criteria.) I would treat the percentile as accurate and the “-75% versus average” column as unreliable.
Booking Holdings looks similar at first, with a P/E of 19.0 against 58.7. But its EPS went from $6.91 in 2024 to $6.62 in 2025, so the earnings did not grow. The multiple fell because the price did. Two stocks at the same percentile, two different reasons.
The one that is not cheap at all
Honeywell shows a P/E of 7.9, the lowest number on the page, against an average of 24.9. Nothing about Honeywell suggests a business worth eight times earnings. Its fiscal 2025 diluted EPS was $14.72, down from $17.42 the year before. Divide the current price by that annual figure and you get a P/E near 14.
The gap between 14 and 7.9 has to come from the trailing figure. Working backwards from the snapshot price of $206.46 and a P/E of 8.0, the trailing EPS behind the ratio is about $25.8, well above the $14.72 the company reported for 2025. Something inflated the last four quarters, most likely a one-time gain. I cannot identify it from our tables, so I would call it unexplained and not build a thesis on it. The stock is down about 23% from its high, which may be a fair price for a business earning $14.72, not $25.
This is the check I would apply to any name on the list. Compare the trailing EPS to the last full fiscal year. If the two differ by more than about a third, the P/E is telling you about the denominator.
Multiples that are low for ordinary reasons
Not every entry needs an asterisk. McDonald’s trades at 20.5 times earnings against 26.7, and its diluted EPS was $11.95 in 2025 against $11.39 the year before, so its earnings are moving up slowly while the multiple drifts down. Aon, at 16.7, has EPS of $17.02 versus $12.49 a year earlier. Neither looks distorted. What they share is that investors are paying less per dollar of stable earnings than they did, and whether that is a bargain depends on what you believe about growth.
Duke Energy and PepsiCo, both in the bottom ten, are the type you would expect: slow growth, dividends, and multiples that follow interest rates. A multiple below history for a utility often says more about rates than about earnings.
The ten at the top
At the other end, all ten sit above the 95th percentile. Deere leads the list with a P/E of 38.0 against an average of 19.5, or roughly double.
| Stock | P/E now | Five-year average | Percentile | Now vs average |
|---|---|---|---|---|
| Deere (DE) | 38.0 | 19.5 | 99.8 | +95% |
| ING Groep (ING) | 14.0 | 9.3 | 99.4 | +51% |
| MPLX LP (MPLX) | 12.9 | 10.8 | 99.3 | +19% |
| Banco Bilbao Vizcaya Argentaria (BBVA) | 13.2 | 7.7 | 99.3 | +72% |
| Vale SA (VALE) | 30.5 | 7.9 | 97.8 | +285% |
| General Motors (GM) | 38.2 | 9.6 | 97.8 | +300% |
| BHP Group Ltd (BHP) | 21.9 | 12.9 | 97.1 | +70% |
| Nokia Oyj (NOK) | 73.7 | 24.7 | 96.3 | +198% |
| Banco Santander (SAN) | 11.9 | 7.7 | 95.5 | +54% |
| Royal Bank of Canada (RY) | 18.0 | 13.5 | 95.1 | +33% |
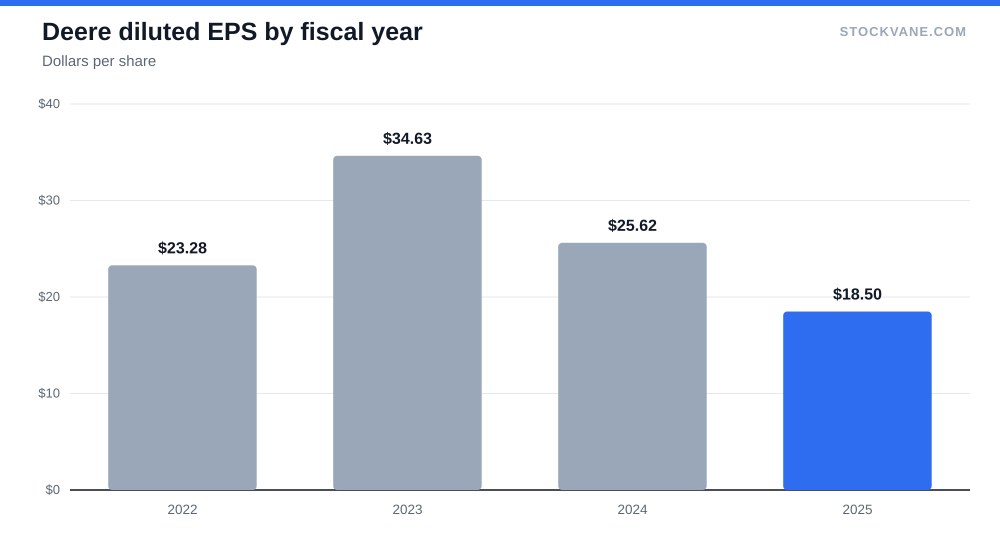
Deere is the clearest example of the artifact in reverse. Its diluted EPS was $34.63 in 2023, $25.62 in 2024 and $18.50 in 2025. Earnings fell by 47% in two years while the stock stayed within 3% of its 52-week high. So the multiple rose, not because investors grew excited, but because the price held while the denominator shrank. The market is looking past the current earnings to a recovery. Whether it is right is the entire debate, much as with Costco at 50 times earnings, where the multiple carries the whole argument. A cyclical company at a peak multiple on trough earnings has historically looked expensive right before earnings turn, and it has also looked expensive right before they failed to turn. The screen cannot tell you which.
General Motors follows the same script at greater scale. Its P/E of 38.2 is four times its five-year average of 9.6. Diluted EPS dropped from $7.32 in 2023 to $6.37 in 2024 and $3.27 in 2025, and the trailing figure behind the current ratio is about $2.24. Vale is the same story with more distance: 30.5 times earnings against 7.9, after net income fell from $18.9 billion in 2022 to $2.0 billion in 2025. In each case the multiple is high because profit has fallen, and I would not describe any of them as expensive in the sense of a price that has run ahead of the business.
Banks are the other cluster, and the contrast with JPMorgan at 15 times earnings is instructive. ING, BBVA, Santander and Royal Bank of Canada all appear near the top. Their multiples are in the low teens or high teens, but their five-year averages were lower: Santander at 11.9 against 7.7, BBVA at 13.2 against 7.7. Bank shares have re-rated after several years of low multiples. That is a real repricing and not an accounting distortion, though it also means the easy gain from the low multiple has been taken.
Nokia and Palo Alto Networks deserve a footnote. Nokia’s P/E is 73.7 on EPS of about 14 cents, and Palo Alto’s is in the hundreds. When earnings are that small, the P/E swings wildly on small changes in profit, and the percentile is unstable.
What the two lists tell us together
Of the 258 stocks, 147 trade at a P/E above their own five-year average and 111 below it. The ranking is therefore not lopsided, and there is no obvious market-wide signal in it. What it shows instead is that the extremes are dominated by companies whose earnings moved sharply in either direction.
Set the two lists side by side and a pattern appears. The bottom ten are mostly steady businesses whose share price has fallen or stalled: Boston Scientific, McDonald’s, PepsiCo, Duke. The top ten are mostly cyclicals whose profits have dropped: Deere, GM, Vale, BHP. If you buy low percentiles you are buying quality that has gone out of favor. If you buy high percentiles you are betting on earnings recovery. Those are different bets, and only the first one is about valuation.
What I am not covering: I did not screen smaller stocks, where percentiles are noisier, and I did not use forward earnings, which would change the picture for the cyclicals in particular.
The filter I would add before trusting either list
Take any name on these lists and ask one question: is trailing EPS within a third of the last full fiscal year’s EPS? Honeywell fails it, at about $25.8 versus $14.72. GM fails it in the other direction, with trailing EPS of about $2.24 against $3.27, a 31% gap that is right at the margin. Boston Scientific and McDonald’s pass.
If a stock passes and still sits in the bottom 1% of its history, that is where I would spend research time. Boston Scientific is the one I would open first, because the earnings rose 55% while the shares fell 59% below their high. If Deere’s next reported EPS comes in above $18.50, its multiple falls without the price moving, and the top of this list starts to look less stretched.
Financial disclaimer: The content on StockVane is for educational and informational purposes only and should not be construed as professional financial advice. Stock market investing involves risk of loss.
Sources: Dividends (SEC Investor.gov glossary) (https://www.investor.gov/introduction-investing/investing-basics/glossary/dividend) · Dividends tax topic (IRS) (https://www.irs.gov/taxtopics/tc404)