
Meta’s operating cash flow was $32.2 billion in the March quarter and $31.9 billion in the June quarter. Almost identical. What the company kept after paying for buildings and hardware was not: $13.2 billion in the first quarter, $1.7 billion in the second.
That gap is what an article titled “Meta Spent $19 Billion in One Quarter on AI, and Stock Dropped 10%” turned into over the summer. The $19 billion still holds up. The story around it has moved on, and I think the more useful reading now is that the market sold Meta twice on the same fear, that the spending would eventually eat the cash the ad business throws off, and that the second sale came with evidence.
The thesis I will defend below is narrow. Meta’s advertising engine is still growing at a rate few companies its size can match, but by the June quarter the AI build had absorbed nearly all of the cash that engine produced, so the stock at about 666 is a bet on the third and fourth quarters, not on the first two.
The $19 billion, measured
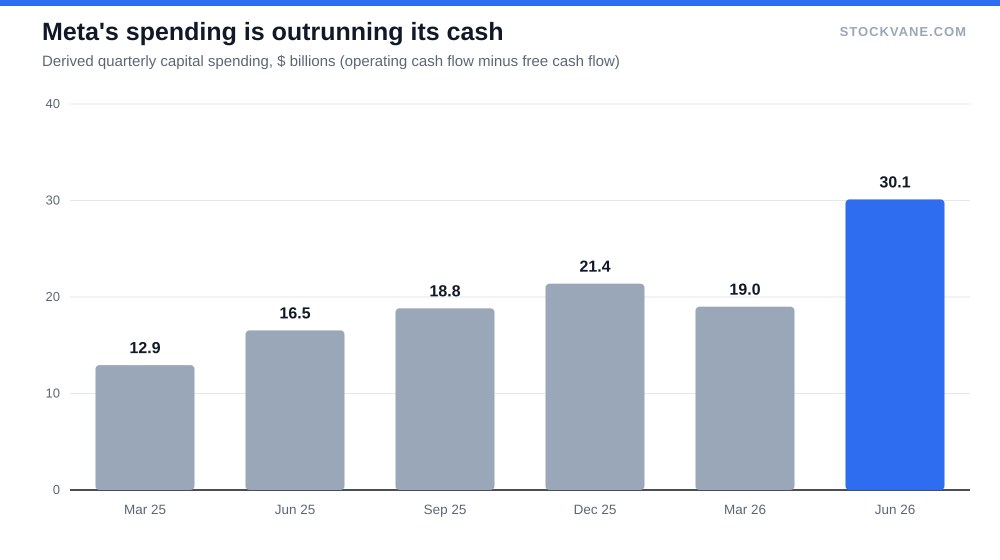
The financials page does not carry a capital spending line for Meta, so I derived one: operating cash flow minus free cash flow. On that basis the March quarter came to about $19.0 billion, up 47% from $12.9 billion a year earlier. The company’s own reported figure can differ a little because of how finance leases are counted, but the size of the number is not in doubt, and it matches the title.
The stock reaction is where the title rounds up. From the April 29 close of $668.50, Meta fell 8.6% the next day to $611.34, and 9.6% by May 5. Call it 10% if you count a few sessions, but the one-day number is 8.6%.
| March quarter | June quarter | |
|---|---|---|
| Revenue | $56.31B (+33%) | $60.80B (+28%) |
| Operating income | $22.9B | $18.8B |
| Operating margin | 40.6% | 30.9% (year earlier 43.0%) |
| Capital spending, derived | $19.0B | $30.1B |
| Free cash flow | $13.2B | $1.7B |
| Stock move the day after | -8.6% | -8.0% |
The operating results that quarter were strong. Revenue was $56.31 billion, up 33% from a year earlier, and operating income was $22.9 billion, a 40.6% margin. Net income was $26.8 billion, higher than operating income, which means items below the operating line lifted it. Our data does not say which items, so I would not use that quarter’s net income or its earnings per share of $10.44 as a clean run rate.
The June quarter was the bill
Revenue rose to $60.80 billion, up 28%, and capital spending on my measure jumped to $30.1 billion, up 82% from $16.5 billion in the June 2025 quarter. Operating income came in at $18.8 billion, a margin of 30.9% against 43.0% a year earlier.
Twelve points of margin is a lot to lose in one year for a company still growing revenue at 28%. I read it as the depreciation and running costs of the servers arriving before the revenue they are meant to earn. That is an inference, not something the numbers prove, and the company’s own commentary would be the place to check it.
Net income was $15.8 billion, down 14% from the year before. Free cash flow was $1.7 billion. The dividend cost $1.35 billion in the same quarter, so for the first time in the eight quarters I looked at, the cash left over did not cover the payout with anything to spare. There is no liquidity problem here. The point is that the buffer is thinner than it has been.
The stock fell 8.0% the day after, from $585.61 to $539.03. Investors who had held through April’s drop took a second one three months later.
The longer record explains why the market has been patient. Annual revenue grew from $116.6 billion in 2022 to $201.0 billion in 2025, and operating income from $28.9 billion to $83.3 billion, a nearly threefold rise in profit on a 72% rise in sales. A company that has done that once earns the benefit of the doubt on its next big outlay. It also raises the bar. When a business has taught investors to expect operating margins above 40%, a quarter at 30.9% reads as a departure from the pattern, not a rounding error.
Two drops, two different reasons
The April sale, I think, was about the plan: management was telling investors how much it wanted to spend. The July sale was about the result. Margin and cash flow had already moved. Similar drops, different information behind them.
That matters for anyone comparing this with Microsoft’s AI bill, where the question is whether cloud revenue grows fast enough to carry the servers. Meta has no cloud line. Its servers have to earn their keep through better ad targeting, and revenue growth of 28% in June against capital spending growth of 82% is the ratio to keep in mind: spending is growing about three times as fast as sales.
Look at the last five earnings days. Meta rose 11.3% after the July 2025 report, fell 11.3% after October’s, rose 10.4% after January’s, and then fell 8.6% and 8.0% after the two 2026 reports. A move of this size on report day is normal for Meta, so the size alone proves nothing. What is unusual is direction: the last two are both down, after a year in which the market rewarded whatever Meta said about AI.
I am not going to claim more about why buyers or sellers acted, because our news feed carries no article that attributes either day’s move to a specific cause.
What has happened since
The stock closed at $665.75 on September 18. That is 23.5% above the July 30 low, 15% below the 52-week high of $784, and within 0.4% of where it stood the day before the April report. In plain terms, the shares have recovered the whole of the spring drop while the cash flow has gone the other way.
I do not read that as a contradiction. It is what a market does when it decides the spending is an investment with a payoff date, and the more recent buyers are betting the payoff is close. The valuation page shows a trailing P/E of 24.4, against a five-year average of 24.8, and a forward P/E of 21.0. The stock sits at its own history on trailing earnings and below it on forward earnings. The forward number only works if earnings per share recovers from the June quarter’s $6.18, which was down from $10.44 in March.
Compare that with Alphabet, which trades at a lower multiple than Meta and has its own cloud line to point to. Meta’s return has to come through advertising. The evidence so far is that advertising is growing. It is not evidence that each dollar of spending is producing a measured dollar back.
What the analysts and the counter-case say
Of 43 analysts covering Meta, 86% rate it a buy and none a sell. The average target is $758, about 14% above the price. The lowest target, $580, sits about 13% below it. For a stock owned this widely, a single analyst who sees a lower price than today’s is the one I would read carefully.
The strongest argument against my cautious read is the ad business itself. Revenue growth of 33% and then 28% at this size has no recent parallel, and if it continues, the margin can recover as the servers fill up. If the June quarter is the low point for margin, then twelve points lost this year is a temporary price for a lasting asset. The argument for caution is the reverse: $49.1 billion of spending in the first half, on my measure, has left June operating income at $18.8 billion against $20.4 billion a year earlier, and the plan is for more.
One more thing I would do before trusting any single quarter: check it against the four before it. Derived spending ran $12.9 billion, $16.5 billion, $18.8 billion and $21.4 billion from March to December 2025, so the June 2026 figure of $30.1 billion is a step up from a rising line, not a one-off spike. That makes a snap back to earlier spending levels unlikely, and it is why I treat the margin question as a year-long one.
I am not covering Reality Labs in detail. The database shows it brought in $431 million of revenue in the June quarter, about 0.7% of the total, and that is all the segment data I can verify. A loss figure would need the company’s own filing.
For a wider view of how the market is paying for AI capacity across the sector, our look at Oracle’s backlog is the best comparison, since Oracle is the case where the spending is contracted before it is built.
The cash figure that ends the argument
Free cash flow is the number I would watch for the September quarter. In the March quarter it was $13.2 billion, and in the June quarter $1.7 billion against a dividend bill of $1.35 billion. My line is $5 billion. If Meta can spend at the June pace and still keep more than that, the margin loss is temporary and the stock’s recovery is earned. If free cash flow is again below the dividend, the market’s forgiveness of the spring will look premature, and I would not add at $666.
Financial disclaimer: The content on StockVane is for educational and informational purposes only and should not be construed as professional financial advice. Stock market investing involves risk of loss.