
A $499 subscription sounds like a lot until you put it next to a $10,000 account, and then it sounds like a lot for a different reason: it is 5% of the money, charged before a single stock has moved. That one number is the reason I think most people should decide whether to use Seeking Alpha’s Alpha Picks by doing arithmetic first and reading testimonials second.
The record is real and, by the service’s own published figures, strong. My view is that the record is the smaller part of the decision. What decides whether you capture any of it is how much money you have, how many picks you can actually buy, and whether you can hold positions through stretches that feel wrong.
What the service is
Alpha Picks launched in July 2022 as a stock-picking product built on Seeking Alpha’s quant rating system. Subscribers get two picks a month, added to the portfolio on the 1st and the 15th. The model scores U.S. stocks on five things: value, growth, profitability, momentum and revisions to forward earnings estimates. Descriptions of the rules say a stock must hold a Strong Buy quant rating for 75 consecutive trading days before it can be considered.
That filter is a design choice worth understanding. It screens out stocks that flashed a good score for a week and favors ones that held it. If you want to see how a grade built from several metrics looks in practice, our stock ratings page gives StockVane’s own.
The selling side is rules-based too. According to published descriptions, a stock that stops scoring well, or that sits at a Hold rating for 180 days, is removed. Winners that double are handled differently from other positions. I would read the current rules on the service page before paying, because they can change and I do not want you relying on my summary of them.
What the record claims
Third-party reviews of the service, citing its published figures, put the total return since launch at about 348% as of early September 2026, against about 104% for the S&P 500 over the same period. They report an average pick return of about 115% against about 29% for SPY on the same picks, and a share of winning picks around 70% to 73%, rising to roughly 75% for positions held one to three years. The service says its returns are calculated by S&P Global.
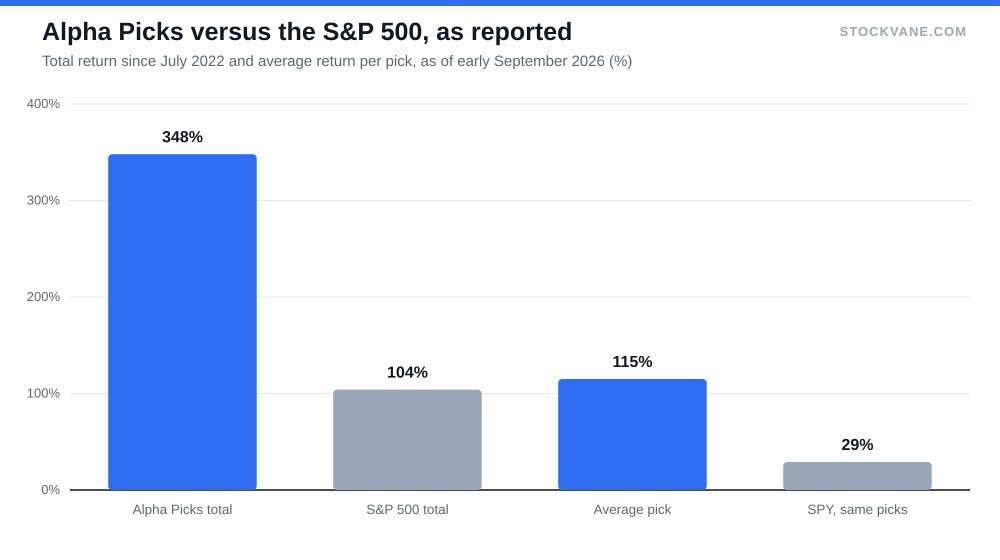
Take those as reported and not as audited by us. We have not verified them independently. Even so, the shape of the claim matters. The gap between the average pick and the average return of SPY is roughly 4 to 1, and the win rate above 70% is high for any stock-picking method. Both point to a method that works when the market is rising, which is most of what the last four years have been.
That is also the limitation. The record starts in mid-2022 and has run through a strong market. It has not yet been through a multi-year bear market, and no review can tell you how the picks behave through one. I would treat the result as evidence of a good process in good conditions, not as a guarantee.
The arithmetic before the enthusiasm
The list price is $499 a year, and reviews note promotional prices, around $449 in mid-2026, that come and go. The cost is fixed, so it matters far more to a small account than a large one.
| Account size | $499 fee as % of account | Break-even outperformance in year one | Equal split across 24 picks |
|---|---|---|---|
| $5,000 | 10.0% | 10.0 percentage points | $208 a pick |
| $10,000 | 5.0% | 5.0 percentage points | $417 a pick |
| $25,000 | 2.0% | 2.0 percentage points | $1,042 a pick |
| $50,000 | 1.0% | 1.0 percentage points | $2,083 a pick |
| $100,000 | 0.5% | 0.5 percentage points | $4,167 a pick |
At $10,000 the fee is about 5% of the account. To break even in the first year, the service has to add roughly five percentage points over what you would have earned without it. At $50,000 the same fee is 1%, and at $100,000 it is 0.5%. The same subscription is a heavy cost for one investor and a rounding error for another.
The second number in the table is how much you can put into each pick. The portfolio adds 24 stocks a year. If you followed it with $10,000, an equal split leaves you with about $417 a pick. With $5,000 it is about $208 a pick, which is small enough that trading fees and share prices start to matter. At $25,000 it is about $1,042. You can follow the model with less, but the smaller the account, the less of the portfolio you can actually own.
Use our position size calculator to see how a smaller allocation per pick affects risk before you subscribe.
Following the whole portfolio, not a favorite subset
The published return is a portfolio return. It counts every winner and every loser at the sizes and dates the model chose. If you buy only the picks that look exciting, you are not getting that return. You are running a different strategy that happens to use the service’s list.
Reviews of the service repeat this point, and I think it is the most important one. People who cherry-pick tend to choose familiar names and skip the ones they do not understand. The names they skip are often the cheaper, less popular ones where a quant screen has an edge. That is a plausible risk, not a measured one, so I would not push the point further than that.
The dispersion inside the portfolio can also be large. A method with a 70% to 73% win rate loses on more than one pick in four. Some of those losses will be deep. Holding the full portfolio means accepting that every year will include several names that you would not have chosen to own and some you will want to sell early.
To make that concrete, suppose 70% of the 24 picks in a year make money. That leaves about seven that do not. If each of those seven lost 30% and you held $417 in each, the damage would be about $876, or 8.8% of a $10,000 account, before counting any winners. That is a hypothetical, not a forecast, but it shows the size of the losses you would need to sit through while waiting for the winners to compound.
Time is the other cost
The service is designed for a holding period of at least a year, though the sell rules can remove positions sooner. That means the gains show up slowly and the fee is due immediately. If you subscribe in month one and judge it by month six, you will be judging it on a portfolio of a dozen positions bought at different times, most of which have not had time to work.
For that reason I would set a rule before starting: follow the model for at least two full years or do not subscribe. That is long enough to see the sell rules operate and to hold through at least one bad stretch. It is not a guarantee of profit. It is a fair test.
Taxes are part of that test. In a U.S. taxable account, a position sold within a year is generally taxed at ordinary income rates, and the sell rules can produce sub-year holds. Whether the service beats an index fund after tax depends on your bracket and on how many picks are sold early, which is something the published return figures cannot tell you.
If you want to compare the service with the ordinary subscription, our Alpha Picks versus Premium comparison sets out what each product includes, and our Seeking Alpha review covers the research library that comes with the standard plan.
What I cannot tell you
I cannot tell you which picks will work, and neither can the service. I also cannot tell you how the record would look if the first two years had started in a falling market, because it did not. What the available figures support is narrower: a rules-based process has beaten the S&P 500 by a wide margin over about four years, with a win rate that most stock pickers would envy. Whether that survives a full cycle is the open question, and paying $499 a year means paying for the chance to find out.
Who I think it fits
Alpha Picks makes the most sense for someone with at least $25,000 to put to work over time, who wants a rules-based process because they know they interfere with their own decisions, and who is willing to buy every pick. It makes less sense for someone with $5,000, because the fee eats a large share of the account and the position sizes become awkward.
It also makes little sense for anyone who wants to trade around the picks. The design assumes you buy, hold and let the sell rules decide. If you already have a research process you trust, the service will not add much beyond another source of ideas.
The version I would follow
If I were starting today, I would decide the account size first. Then I would work out the per-pick amount from the table, check whether I could tolerate losing on more than one pick in four, and commit to two years. If I could not say yes to all three, I would keep the $499 and buy a broad index fund with it.
If I could, I would follow the entire portfolio and ignore my preferences about individual names. The strongest evidence in the record is not a return figure. It is that a rules-based method has held up for four years, and the only way to test it for yourself is to follow the rules.
Financial disclaimer: The content on StockVane is for educational and informational purposes only and should not be construed as professional financial advice. Stock market investing involves risk of loss.
Sources: Earnings reports (SEC Investor.gov glossary) (https://www.investor.gov/introduction-investing/investing-basics/glossary/earnings-report) · How to read a company's 10-K (SEC Investor.gov) (https://www.investor.gov/introduction-investing/investing-basics/glossary/10-k)