
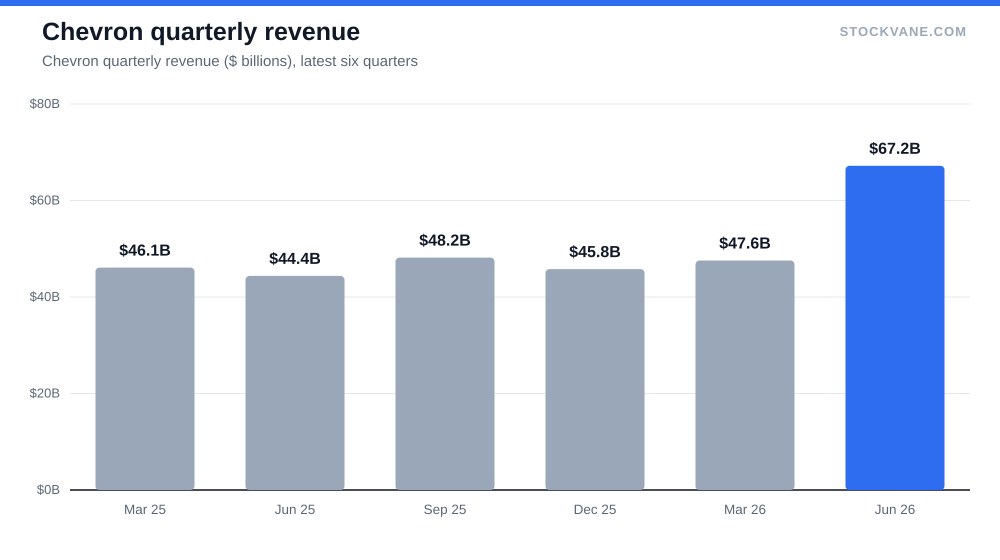
Chevron booked $67.2 billion of revenue in its latest quarter. The quarter before that was $47.6 billion. That is a 41% jump in three months, and a 51% jump on the same quarter a year earlier, for a company whose revenue fell 5% in fiscal 2025. Our data doesn’t say why. The likely candidates are the Hess deal, higher oil prices, or both, and I would rather tell you that than pick one and sound sure.
The reason this matters for a forecast is that the market has noticed. The stock is $209.51, up 47% from its 52-week low and 4% below its high. Chevron’s Guyana bet is doing what it was supposed to do. What I want to know is how much of that is already in the price.
What the income statement says before the deal shows up
Start with the years before the jump, because the jump is easy to overread. On the financials tab, revenue peaked at $235.7 billion in 2022 and came down to $184.4 billion in 2025, a fall of 22%. Operating income fell from $40.0 billion to $16.7 billion, and the operating margin slid from 17% to 13.3%, then 9.8%, then 9%. Net income dropped 65%, from $35.6 billion to $12.5 billion, and diluted EPS from $18.28 to $6.63.
That is three years of a business shrinking in dollars while the share price held up. Part of that is oil prices normalizing after the 2022 spike, and I don’t have a price series for crude in our database, so I won’t put a number on it. What I can say is that fiscal 2025 was the low, on these figures, and the latest quarter is the first evidence of a turn.
A quarter that changes the shape of the chart
The latest quarter’s segment data shows upstream revenue of $34.5 billion and downstream of $54.1 billion, with intersegment eliminations of about $21.6 billion taking the total to $67.2 billion. That is a lot of internal trade. It tells you that the refining side of Chevron buys heavily from the production side, which is why the company’s results follow the oil price so closely and why one segment’s strength does not always show up as clean profit.
The Hess acquisition, which closed in 2025, gave Chevron a stake in Guyana’s Stabroek block. That much is outside our database, so treat it as background and not as a number I checked. The block is widely described as one of the lowest-cost offshore developments in the world, and if that description holds, Guyana barrels should lift margins over time. But the figures we do have don’t yet show it. The operating margin through 2025 was still falling.
Put the four quarters side by side and the break is obvious: $48.2 billion, $45.8 billion, $47.6 billion, then $67.2 billion. The first three sit in a band of about $2.4 billion. The fourth is $19.6 billion above the third. Nothing in a normal quarter moves revenue that far unless something structural changed, and I would want to see the next report before assuming the new level is the baseline.
I’d be careful with one quarter. A revenue jump of that size can come from volume, price, a larger consolidation perimeter, or a mix of the three, and each of them implies a different forecast. Price gains can reverse in a quarter. Volume from a new field cannot.
Cheap on next year, full on this year
Here is where the price argument comes in. The valuation tab puts trailing P/E at 20.2, against a five-year average of 17.3 and an industry figure of 13.0. On trailing earnings, Chevron is priced above both. Price-to-book is 2.2, above the top of its five-year band at 2.1 and in the 93rd percentile of its own history.
The forward P/E tells a different story. It is 14.3, close to the industry’s 13.0. Compare the implied earnings: about $10.39 a share over the last twelve months, and about $14.61 for the next twelve, a gain of 41%. That forecast assumes the recovery continues, and it is the number the whole valuation leans on.
So the argument is about timing. If the forward earnings arrive, Chevron is roughly fairly priced against its peers. If they slip, it is expensive on a trailing basis and on book value at the same time, which leaves less to fall back on. I see a stock that has already paid for the good news and now needs the earnings to follow.
Sensitivity helps here. At 14 times earnings, every $1 of forward EPS that fails to arrive costs about $14 of share price, so a miss of $2 takes roughly $28 off, or 13% of today’s value. That is the size of the bet on the recovery, and it is larger than the 5% the average analyst target offers on the upside.
The dividend is 3.33%, which gives a holder something for waiting. It is a reasonable yield and not a reason to ignore the multiple.
What the last four reports did to the stock
The stock moved +2.4% after the latest report, -1.4% after the one before, then +3.3% and +2.7%. Three of the four were gains. Gains on report days fit a stock whose earnings were expected to fall and then didn’t, though that is my reading, not something the data confirms. Our data doesn’t connect the moves to specific causes, so I won’t offer any.
Our feed also carries a September 3 headline that Chevron plans to invest $7 billion, but the title is cut off and I can’t tell where the money goes. I mention it only because capital plans matter to the forecast: spending drives cash returns.
Analysts see 5%, and the lowest target is under the price
Of 16 analysts, 81% say buy and 19% hold. The analyst page lists an average target of $220, about 5% above the price. The high is $243, 16% up, and the low is $205, about 2% below. A consensus that thin says the Street has moved its targets up with the stock and now sees limited upside.
Our quant model rates Chevron a C at 65, up from a C at 55 on September 8. That is a modest improvement in the model’s read of momentum and fundamentals, and I would not lean on it.
| Metric | Value | Context |
|---|---|---|
| Price (approx.) | $209.51 | 52-week range $143 to $218 |
| P/E (TTM) | 20.2x | Five-year average 17.3x |
| Price-to-sales | 2.0x | Five-year average 1.6x |
| Analyst ratings | 81% buy, 19% hold | 16 analysts; average target $220 |
| Dividend yield | 3.33% |
What I am not covering
I am leaving out reserves, production volumes and the cost of the Hess deal, because none of them are in our database and I won’t estimate them from memory. Those are the inputs a specialist would use to value Guyana directly. My approach is narrower: take the earnings the market implies, compare them with what the company has reported, and ask how much room the price leaves for a miss. It is a cruder method, but it rests on numbers I can show.
The oil price is still the boss
Nothing above changes the old rule that Chevron is an oil stock first. A stake in Guyana lowers the average cost of a barrel, but it doesn’t set the price of one. Exxon’s forecast has the same structure, as I argued in the piece on its discipline, and Middle East risk can move all of it at once, which our August note on Iran and Israel covered.
The counter-case is a plain one. If oil prices fall back and the 51% revenue jump turns out to be mostly price, the forward EPS of $14.61 goes with it. At the 2025 level of $6.63, today’s price would be about 32 times earnings. I can’t rule that out from the data I have.
Only 1.0% of the float was short at the end of August, with roughly 2.6 days to cover. There is no crowd betting on the drop, which also means no short covering to lift the stock if the news is good.
A grid, not a target
I would not put one price on an oil stock. Instead, here is the arithmetic on the forward earnings the market is using.
| Forward EPS Multiple | 11x earnings | 14x earnings | 16x earnings |
|---|---|---|---|
| $11.50 a share | $126 | $161 | $184 |
| $14.60 a share | $161 | $204 | $234 |
| $17.00 a share | $187 | $238 | $272 |
The middle row is where the stock trades today: about 14 times $14.61. The bottom-left corner, $11.50 at 11 times, gives $127, about 40% below the current price, and it is the outcome I would want protection against. The top-right corner needs $17 and 16 times, and I would not underwrite that.
The line I would draw at $190
I would not add Chevron here. The stock has done well, the quarter was strong, and the forward multiple already assumes the earnings arrive. If I wanted to own it, I would sell a cash-secured put near $190, about 9% below the price and 13 times the $14.61 forward figure, which matches the industry multiple. I explained how I size those trades in the put-selling guide. The number to watch on the next report, due at the end of October, is whether revenue stays near $67 billion or falls back toward $48 billion. If it holds, the case for the higher earnings gets stronger. If not, $190 is where I would want to be.
Gavin Thorne has invested in U.S. stocks for six years and previously worked at a large publicly traded internet company. He writes about income-oriented strategies, including cash-secured puts, and about how he reads company data. This article reflects his personal research process and is for informational purposes only. It does not constitute investment advice.
Sources: Dividends (SEC Investor.gov glossary) (https://www.investor.gov/introduction-investing/investing-basics/glossary/dividend) · Dividends tax topic (IRS) (https://www.irs.gov/taxtopics/tc404)