
Home Depot pays $9.26 a share in dividends and earned $14.23 a share in its last fiscal year. That is 65 cents of every earned dollar handed back to holders, and it is a bigger share than it was two years ago, because the earnings underneath it have shrunk while the payout has not.
The shrinkage is not dramatic. Diluted EPS went from $16.69 in fiscal 2023 to $15.11, then $14.91, then $14.23. Three years, three declines, a cumulative drop of about 15 percent. Revenue over the same stretch rose from $157.4 billion to $164.7 billion, up 5 percent. Sales grew and profit fell, and that gap is the whole argument for owning or avoiding this stock right now.
My view: at $300, 25.6% below its 52-week high, Home Depot is priced as a housing-cycle stock waiting for the cycle, and the price is fair rather than cheap. The dividend pays you to wait. It does not pay you to be wrong about the margin.
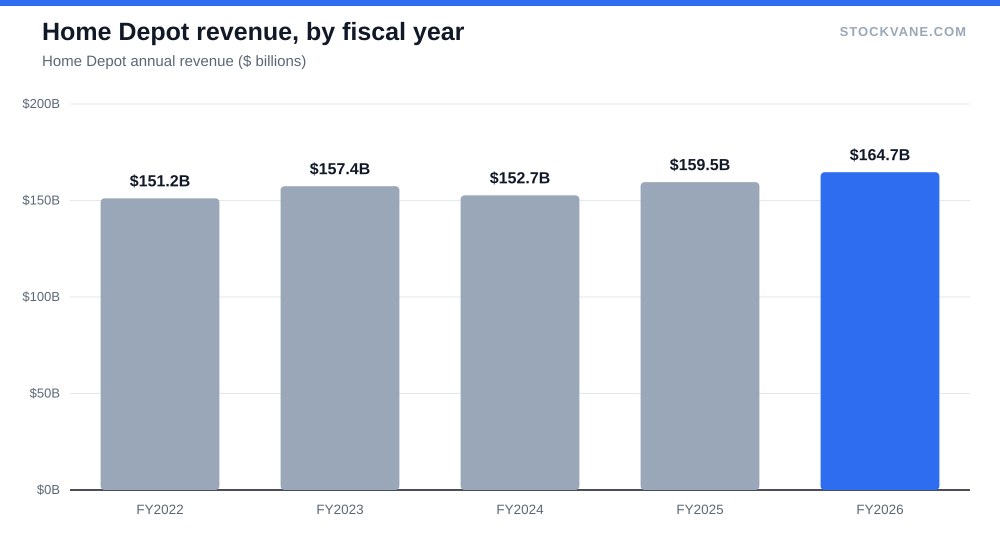
Sales up, operating income down
Look at operating income in the database: $24.04 billion in fiscal 2023, $21.69 billion in 2024, $21.53 billion in 2025, $20.89 billion in 2026. The last figure sits $3.1 billion, or 13 percent, below the 2023 peak, on a revenue base that is larger.
Margin is where that shows up. The financials tab carries an EBIT margin of 12.8% for the latest year, against 15.3 percent in fiscal 2023. (Straight operating income divided by revenue gives 12.7 percent; I use the database EBIT figure throughout and say so, since the two definitions differ slightly.) A loss of roughly 2.5 points on $165 billion of sales is about $4 billion of profit that a 2023-style margin would have kept.
Gross margin tells a quieter story. It was 33.3% in the latest year and 33.4% the year before, a tenth of a point. So the retailer is not losing money on what it sells. The pressure sits below the gross line, in the cost of running stores, labor and the fixed overhead that has to be spread over whatever mix of projects customers are willing to fund. When ticket sizes shrink, that overhead gets no relief.
I would be careful about telling this as a tale of a single cause. The company does not break out project sales by size in the data I have, so the statement that big-ticket remodel work has gone missing is an inference from the shape of the margin, not a reported number. It is a reasonable inference. It is not a measurement.
What the latest quarter did and did not show
The quarter reported on 2026-08-18 produced $47.9 billion of revenue, up 6% from the same quarter a year earlier. The stock moved -0.1% the next day, which is close to nothing. Over the past four reports the average absolute move has been 2.2%, and the largest was a 6.0 percent drop in November 2025.
That reaction pattern is informative. A retailer whose earnings can shift the stock by only 2 percent is one the market already thinks it understands. Expectations are set; a report that merely confirms them changes nothing. What would move the stock is evidence that the margin has stopped sliding, and a quarter of 6 percent revenue growth alone does not supply that, since the margin trend persisted through it.
Annualizing the latest quarter gives $191.4 billion, which is above the full-year figure. I do not lean on it: this business is seasonal and the June-to-August quarter is its strongest. Treat the run-rate as a ceiling, not a forecast.
Valuation: fair, not cheap
The trailing P/E is 21.0, and the current multiple in the valuation data is 21.8, against a five-year average of 22.6 and a five-year range of 19.3 to 25.9. That puts the stock at the 37th percentile of its own history: below the middle, but nowhere near the floor. On forward EPS of $14.52 the multiple is 20.7. The implied EPS growth from trailing to forward is only 2%.
Two conclusions follow. First, the forward number assumes the decline ends. Consensus is not modeling another 5 percent EPS drop. Second, the price is not compensating you for that assumption failing. If EPS fell again to about $13.50 and the multiple stayed at 21.8, the stock would be near $294, a modest 2 percent drop from here. If EPS stayed near $14.5 and the multiple slid to the bottom of its range, 19.3, the price would be about $280, and that is below the current 52-week low of $285. That second case is the one I would worry about.
The price-to-sales ratio is 1.8, against a five-year average of 2.2, which is the 3rd percentile of its history. That looks cheap and I do not trust it, because sales are exactly what has not been the problem. A stock is cheap on sales when the market believes the margin on those sales is permanently lower.
| Metric | Value | Context |
|---|---|---|
| Price (approx.) | $299.98 | 52-week range $285 to $403 |
| P/E (TTM) | 21.0x | Five-year average 22.6x |
| Price-to-sales | 1.8x | Five-year average 2.2x |
| Analyst ratings | 74% buy, 26% hold | 23 analysts; average target $391 |
| Dividend yield | 3.09% |
Peers help frame this. Walmart is priced for steadier traffic, and Costco carries an even higher premium for membership income that does not depend on housing turnover. Home Depot sits at the opposite end: a cyclical priced like one.
Cheap on one gauge, fair on another. That is not a screaming buy.
Analysts are more optimistic than the tape
The Street consensus is $391 on 23 analysts, which is 30% above the current price. The lowest target, $342, is still 14% above the price and the highest, $420, is 40% above it. Nobody covering the stock has a target below the market, and 74% rate it a buy.
I would treat that as a signal about sentiment, not about value. Targets track price with a lag; when the stock falls 25 percent from its high, targets come down more slowly, and the gap widens. A 30 percent gap says analysts have not capitulated. It does not say the stock is 30 percent too low.
The StockVane quant score has gone from C to E in the past few weeks. That is a momentum-driven signal, and E is the weakest tier. It reflects the price trend, not the fundamentals, and I would not sell on it, but I would not buy into it either.
Housing sensitivity and what would prove me wrong
Rates matter here more than any operating decision at the company. A homeowner locked into a low mortgage has little reason to move, and a person who does not move does not gut a kitchen. For the macro side, I wrote earlier about why the message around a September Fed move matters more than the move, which is the reason I would watch what the Fed says about the path of rates before I watch any single decision.
Three conditions would make my cautious view wrong. Comparable sales turning positive for two consecutive quarters would show demand returning. Gross margin holding at 33 percent while operating margin stabilizes near 12.8 would show the cost base has been reset. And a reversal in the quant score, driven by price momentum, would say the market believes the first two. Any one alone is not enough.
What could go wrong on the other side is simpler. The margin could keep falling by another point, to around 11.8 percent, which on today’s revenue would remove about $1.6 billion of operating income, roughly 8 percent of what the company earns. The forward P/E on that number would move toward 22, and the stock would sit near $290 only if the multiple did not compress further. It would compress.
The dividend and the balance sheet
The yield is 3.09%, and the payout ratio is 65 percent of trailing EPS. For a company with steady cash flow that is workable. It leaves about 35 cents of each earned dollar for reinvestment and buybacks. It does not leave much room if EPS drops another 10 percent and the board wants to keep raising the payout: the ratio would then be 72 percent.
Price-to-book of 18.7 looks odd next to the 5-year average of 206.7. That average is distorted by years of buybacks that pushed book equity close to zero and even below it, which is why the historical band runs from negative 119 to 533. I would ignore book value for this stock entirely; it says more about the capital return policy than about the business.
Short interest is 0.9% of the float, which is low. Nobody is betting against the company hard. For a stock that has drifted down without a catalyst, low short interest means selling has been long-holder selling, and that kind of selling tends to be slow, not violent. For more on how I read positioning of that kind, see how I analyze money flowing in and out of the market.
The margin line to hold it to
I will keep this simple. At $300 I do not need Home Depot to be a bargain. I need the margin to stop falling. The single line I would watch is the EBIT margin in the next annual report: if it prints at 12.8 percent or better, the decline is over and the stock has earned a multiple at or above 22 times. Below 12.3 percent, I would expect the shares to test their 52-week low of $285 and I would rather be selling puts under that low than owning shares above it.
Gavin Thorne has invested in U.S. stocks for six years and previously worked at a large publicly traded internet company. He writes about income-oriented strategies, including cash-secured puts, and about how he reads company data. This article reflects his personal research process and is for informational purposes only. It does not constitute investment advice.
Sources: Dividends (SEC Investor.gov glossary) (https://www.investor.gov/introduction-investing/investing-basics/glossary/dividend) · Dividends tax topic (IRS) (https://www.irs.gov/taxtopics/tc404)