
Stryker earned $8.25 a share in 2023 and $8.40 in 2025. Revenue over the same two years rose from $20.5 billion to $25.1 billion, a gain of 23%, while diluted EPS moved 1.8%. If you own a company whose sales grow by a fifth and whose per-share profit does not, you are entitled to ask where the extra revenue went.
That question is the story, and it is why I think the title I picked for this post holds up only in part. Stryker does not have a narrative in the sense that Nvidia or Palantir has one: no product cycle that reprices the whole company, no takeover rumor, no patent cliff. But a stock that sits 29.4% below its 52-week high of $389 has a story whether the company wants one or not. The story is that a steady grower has been repriced, and my thesis is that the repricing, not the operations, is what an investor is deciding on today: the business looks unchanged, the multiple is not, and the 28.5 trailing P/E now sits at 0.66 times its own five-year average of 43.3.
What the boring part actually looks like
Revenue, from the financials tab: $14.35 billion in FY2020, then $17.11 billion, $18.45 billion, $20.50 billion, $22.59 billion, and $25.1 billion in FY2025. That is one down year (2020, minus 4%, the pandemic elective-surgery freeze) followed by five up years, with growth of 8% to 19% in each. Since 2022 the pace has settled into a narrow 10% to 11% band. A company of this size, selling implants and hospital equipment into procedure volumes that follow demographics, can produce that kind of regularity almost on schedule.
Gross margin tells the same story with less drama: 63.1% in FY2020, 64.1% in FY2021, and 64.0% in FY2025. Five years, a one-point range. Stryker is not winning by squeezing suppliers or changing what it sells. It is holding price and mix steady while volume grows.
Then the operating line. The DB EBIT margin ran 15.6%, 15.7%, 16.5%, 19.1%, 20.7% and, in FY2025, 20.4%. So the four-year run of improvement that I would have quoted in an older draft of this piece ended a year ago: the last print is 26 basis points lower than the one before. I would not call that a crack. I would call it the first evidence that the easy part of the margin story, the recovery from pandemic-era cost pressure, is finished. (A note on definitions: the operating income of $5.1 billion divided by revenue gives 20%, and the database EBIT margin is 20.4%. They differ slightly because of how non-operating items are classified. I use the EBIT series for the trend.)
The two years where the profit went missing
Now back to the opening arithmetic. Net income by year: $1.60 billion, $1.99 billion, $2.36 billion, $3.17 billion, $2.99 billion, and $3.25 billion. FY2024 is the odd one. Revenue rose 10% and operating income rose from $3.92 billion to $4.67 billion, yet net income fell 5%.
Operating profit went up and net profit went down in the same year, so the difference sat below the operating line. Interest, taxes, or one-off charges are the candidates. I cannot say from the price and financials data which of them it was, and I am not going to guess in print. What I can say is that the pattern matters for how you read the P/E. Trailing earnings of $9.65 per share (the trailing figure the quote page uses) are not the same as the $8.40 diluted EPS for FY2025, and neither is the $14.09 that produces the 19.5 forward P/E. Analyst forward numbers commonly exclude acquisition and restructuring charges. The gap between $9.65 and $14.09 implies 46% growth if you take it literally, which no one at a 10%-revenue-growth company should. I read the jump as a difference in definition, not a forecast that profit will surge. Do not build a valuation on the 19.5 without knowing that.
The practical point is this. If the forward multiple is flattered by an adjusted EPS, the honest multiple is somewhere between 19.5 and 28.5, and the honest discount to history is smaller than the headline. Even at the higher number the stock is cheaper than it was.
Why the multiple moved
Here are the valuation gauges on the valuation tab, all against Stryker’s own five-year history. P/E: 29.0 now versus a 43.3 average. P/S: 4.2 versus 5.7. P/B: 4.5 versus 6.3. All three sit at or near the 0th percentile of the five-year range, which means the stock has not traded this cheaply on its own yardsticks at any point in that window.
Against the industry, the picture is less dramatic. The industry P/E average in the database is 26.3, so Stryker’s 29.0 is a premium of roughly 10%. On price to sales the industry average is 3.1, against 4.2 for Stryker, and on book value 3.0 against 4.5. Read that carefully. Stryker is cheap against its own past, and still not cheap against the group. Anyone who tells you it is a bargain is comparing it to itself; anyone who tells you it is expensive is comparing it to the medical-device average and ignoring that its returns have been better than the average for years. Both are half-arguments.
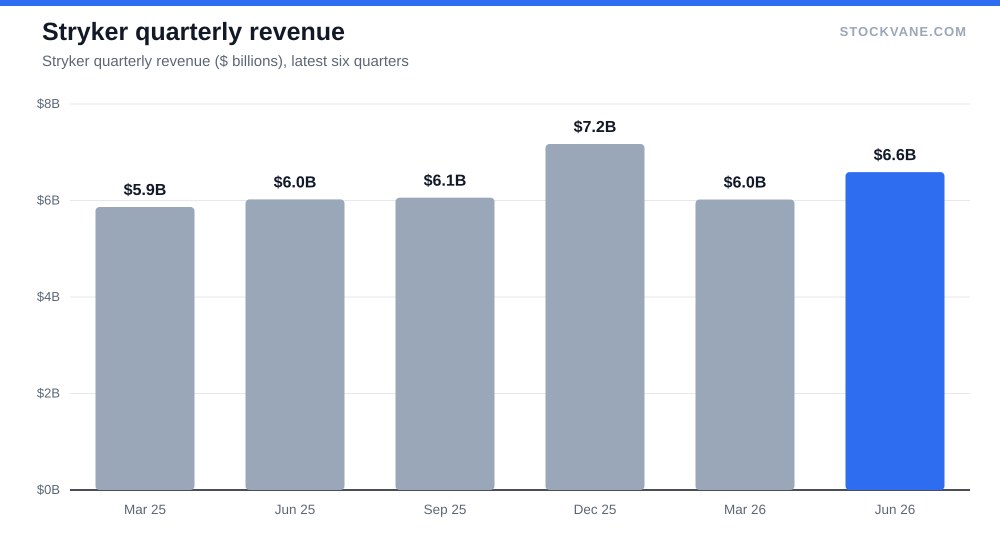
What changed to cause the re-rating? The database has no news item that names one cause, and I will not invent one. What the record does show is the earnings reaction. In the last four reports the stock moved -3.5% (October 2025), +4.3% (January 2026), -6.5% (April 2026) and -6.4% (2026-07-30). Three losses out of four, two of them larger than the 5.2% average move. The July report showed revenue of $6.6 billion, up 9% from a year earlier, and the stock still fell. That is what a market does when it has stopped paying for consistency and started asking for acceleration.
| Metric | Value | Context |
|---|---|---|
| Price (approx.) | $275.12 | 52-week range $267 to $389 |
| P/E (TTM) | 28.5x | Five-year average 43.3x |
| Price-to-sales | 4.2x | Five-year average 5.7x |
| Analyst ratings | 94% buy, 6% hold | 16 analysts; average target $372 |
| Dividend yield | 1.26% |
The counter-case: the market may be right
I have been describing the drop as a repricing, but the honest opposing view deserves its own paragraph. Revenue growth of 9% to 11% is very good for a $25 billion company. It is also below what the stock’s old multiple required. At 43 times earnings, investors were paying for a company that would grow profit in the high teens for years. Profit growth did not deliver that: net income moved $3.17 billion, $2.99 billion, $3.25 billion over three years, an increase of under 3% in total. A share price that rose faster than that for years was borrowing from the future, and the bill has come due as a lower multiple. On that reading the stock is not a mispricing at all; it is a correction of an earlier overpayment.
I cannot rule that out. What I would say against it is that the correction has now gone a long way. A multiple of 29.0 on a business with a 64.0% gross margin and double-digit top-line growth is a price at which the argument shifts. You no longer need profit to accelerate, only to stop lagging revenue.
What the sell side and the tape say
Sixteen analysts cover the stock. 94% rate it a buy, none rate it a sell. Their targets run from $317 to $420 with an average of $372, which is 35% above the price of $275. Even the lowest target is 15% above the market. Wells Fargo reiterated its Buy rating in early September.
I do not put much weight on a 94% buy rating. Sell-side lists lean toward buy ratings by habit, and such unanimity after a 29% drop tells you analysts have not yet adjusted their models, or that they are waiting for the stock to prove them right. It is a stale-price signal as much as a bullish one. The one number I would take from it is the low target: for the whole group to sit above the market means the price is below what the most cautious analyst calculates. That is a fact about the gap, not a prediction.
The quant screen in the database is less friendly. Its grade moved from C to E over the recent window; I do not have the score’s components, so I read it only as a sign that the tape has weakened. Short interest is 2.0% of float, low enough to say there is no crowded bearish bet, and the stock has been sold by holders, not shorted by opponents.
If you are curious how I would read the earnings data that underlies all of this, How to Read an Earnings Report is where I lay out the sequence I use. For the opposite pattern, a stock where every analyst is bullish and the price already reflects it, see my note on Apple. The parallel is worth drawing: consensus is useful when the price has not yet moved, and much less so after it has.
The dividend and the balance of the trade
Stryker pays $3.48 a share, a yield of 1.26%. That is a token payment, and no one should own the stock for it. Its use in this discussion is as a signal of management confidence rather than as income: a company that raises the dividend into a falling stock price is telling you it does not expect the earnings line to fall.
Put in dollars: at $275, one share costs about the same as a year of that dividend multiplied by 79. A holder who bought at the 52-week high of $389 is down about 29.4% and has collected under 1% of it back. The trade is a price-appreciation trade, which means it depends on the multiple, which brings the argument back to where it started.
What I am not covering
I have not modeled the operational drivers: procedure volumes, pricing by hospital system, the mix between orthopaedic implants and surgical equipment, or the capital-equipment cycle for robots. The segment data in the database, for the latest quarter, shows MedSurg and Neurotechnology at $3.63 billion, 55% of revenue, and Orthopaedics at $2.96 billion, 45%. That split says the business is not an implant story alone. Beyond that split I have no measured facts, and I would rather leave the rest out than fill the space with things I cannot check.
The margin line that keeps the label honest
So does Stryker have a story? My answer: it did not have one and now it does, and the story is a price. The company kept growing revenue at 10% to 11%, kept its gross margin within a point of 64%, and moved its operating margin from 15.6% to about 20%. The stock, meanwhile, lost 29.4% from its high and now trades at 29 times earnings, at the bottom of its own five-year range and only 3% above the 52-week low of $267.
The number I would watch is the operating margin in the next annual report. The database shows FY2025 at 20.4%, slightly below FY2024’s 20.7%. If FY2026 prints above 20.7%, the margin story is still running and the de-rating looks overdone. If it prints below 20%, revenue is growing without profit for the third year in four, and I would treat the 43-times era as a one-time excess rather than a level that the stock is likely to revisit. Below $267, the 52-week low, I would want to see that print before adding a single share.
Financial disclaimer: The content on StockVane is for educational and informational purposes only and should not be construed as professional financial advice. Stock market investing involves risk of loss.
Sources: Dividends (SEC Investor.gov glossary) (https://www.investor.gov/introduction-investing/investing-basics/glossary/dividend) · Dividends tax topic (IRS) (https://www.irs.gov/taxtopics/tc404)