
Uber lost $9.1 billion in 2022. In 2025 it earned $10.1 billion. That is a $19.2 billion swing in three years, and the share price is 30.9% below its 52-week high.
I want to be careful with that first number, because most of it is not the story. The clean measure of what changed is operating income, the profit from running rides, deliveries and freight before investment gains, taxes and one-time items. On that line Uber went from a loss of $1.8 billion in 2022 to a profit of $5.6 billion in 2025, a $7.4 billion improvement. My argument is that the losses really are gone, that the stock has gone the other way for a year regardless, and that the gap is explained less by the profit line than by a growth rate that has cooled. Whether the market is right to mark that down is the question worth an hour.
Four years of margin, no step back
Operating margin, meaning operating income divided by revenue, has risen every year since 2021: -22.0%, then -5.7%, 3.0%, 6.4% and 10.7% in 2025. I use operating income over revenue throughout. The database also carries an EBIT margin of 12.0% for 2025, which adds back items the operating line does not, and I would not mix the two.
Revenue did not shrink to get there. It went from $17.5 billion in 2021 to $52.0 billion in 2025, close to three times as much, while gross margin held near 40% (39.4% in 2024, 39.8% in 2025). Revenue outgrowing costs did the work here, and no price hike that could reverse was needed. You can see the full run on the financials tab.
| Fiscal year | Revenue | Operating income | Operating margin | Net income |
|---|---|---|---|---|
| 2021 | $17.5B | -$3.8B | -22.0% | -$0.6B |
| 2022 | $31.9B | -$1.8B | -5.7% | -$9.1B |
| 2023 | $37.3B | $1.1B | 3.0% | $2.2B |
| 2024 | $44.0B | $2.8B | 6.4% | $9.8B |
| 2025 | $52.0B | $5.6B | 10.7% | $10.1B |
Look at the last two rows. Revenue grew 18% in 2025, adding $8.0 billion, and operating income doubled from $2.8 billion to $5.6 billion. About 34 cents of every added sales dollar reached the operating line. That is the payoff when a fixed cost base spreads over more sales.
Why I would not quote the net income
The reported profit is larger than the operating profit, and by a wide margin. In 2025 net income was $10.1 billion against operating income of $5.6 billion. In 2024 it was $9.8 billion against $2.8 billion.
Quarter by quarter it is even less regular. Uber reported net income of $1.77 billion, $1.35 billion, $6.65 billion and $0.32 billion in the four quarters of 2025, and $0.28 billion and $2.42 billion in the first two quarters of 2026. One quarter, the September 2025 period, supplied about two-thirds of the year. No operating business swings like that. Our database does not itemize what sat in the gap, and I will not guess. What I can say is that trailing earnings per share of $4.56 is a poor guide to what the trucks and phones earn.
The market seems to agree. The trailing P/E is 15.5, but the forward multiple is 17.8, higher. Analysts are pricing forward earnings per share of about $3.95, which is 13% below the trailing figure. A stock that looks cheaper on last year’s earnings than on next year’s is telling you last year’s earnings were flattered.
So what should an investor anchor to? I would use operating income and revenue, since both are steady in the data, and treat net income as a footnote until the company explains the gaps in its filings. On that basis the 2025 base is $5.6 billion of operating profit on $52.0 billion of sales. Every valuation argument in the rest of this piece starts there, and each one changes if you decide a different base is fairer. Two readers can look at the same statements, one using $10.1 billion of net income and the other $5.6 billion of operating income, and honestly disagree by nearly a factor of two about what the business earns.
What the stock did while this was happening
A year ago, on September 18, 2025, Uber closed at $94.70. It now trades at $70.50, a decline of 26%. Over those twelve months revenue kept climbing and the operating margin kept its gains. The shares did not follow. The monthly bars read $87.54 for November 2025, $71.93 for March 2026 and $75.65 for August.
Earnings days have not helped. The stock fell 5.3% after the August 5 report. Of the last four reports, three ended the day down by more than 5%, and the one exception, May 6, gained 8.5%. The average move was 6.0% in either direction.
Sentiment is not uniformly bad, which makes the picture stranger. Of the 31 analysts covering it, 90% rate it a buy, and the average price target of $104 sits 47% above the current price. Even the lowest target, $72, is above where the stock trades. On September 11 a headline in our news feed reports an officer buying $10.01 million of common stock. Our quantitative grade moves the other way: it fell from C to E in mid-September, and I read that as momentum, not a verdict on the business. Short interest is only 2.2% of float, so there is no crowd betting against it.
The last week of news shows the same split. On September 10 Arete Research downgraded the stock to Hold. The next day Bernstein kept a Buy with a $95 target, and on September 16 BofA Securities kept its Buy with a $101 target. Both targets are well above the price and both are below the $104 average, so even the bulls have been trimming their sights. A Form 144 filing on September 12 shows an officer proposing a sale of shares; the amount in the headline is ambiguous, so I would not read much into it.
Cheap on earnings, ordinary on operating income
At $70.50 the stock is worth about $144.0 billion. That is 26 times 2025 operating income. That is market value, not enterprise value, since I have not netted out cash or debt, and the enterprise multiple could land either side of it. Either way it is a long way from the 15 times the P/E suggests, and it puts Uber at the opposite end from the stock in our Costco at 50 times earnings piece, where the multiple is the whole debate.
Against its own history the picture is mixed. Price to sales is 2.6, below its five-year average of 3.4, and price to book is 5.3 against 8.7. On both, Uber trades at a discount to itself. The valuation tab has the full range. But the five-year average for P/E in our data, 0.6, is close to meaningless, because it blends years of losses with years of profit. I would not lean on any earnings-based comparison over that window.
That is the honest state of the discount. It exists on sales and book value, it is arguable on earnings and it disappears if you decide reported profit overstates what the business earns. Our piece on why Alphabet is the cheapest big tech stock makes a similar point about a different company: when a large stock sits below its history, the market usually has a reason, and the work is finding whether the reason is temporary.
The counter-case is growth
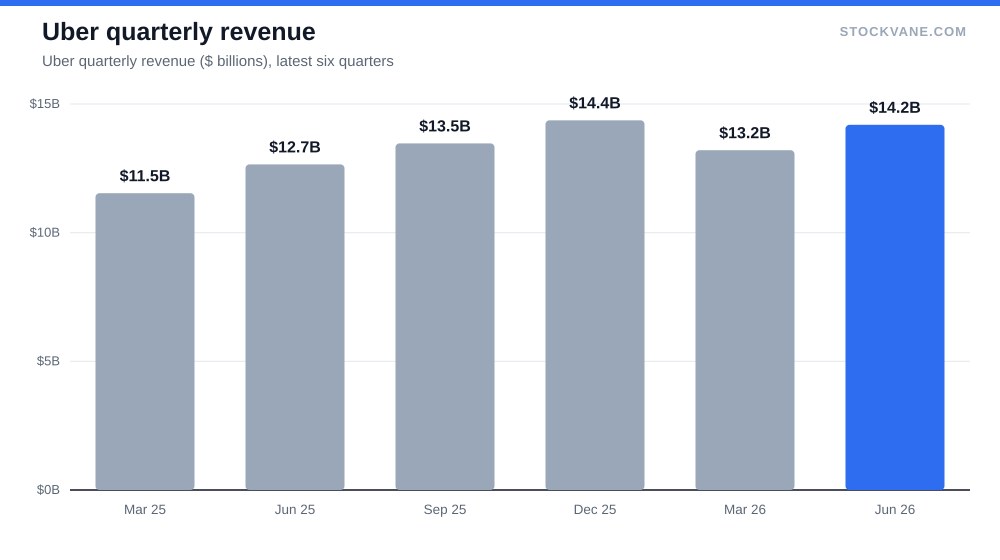
Uber’s quarterly revenue growth, shown on the quote page, has been slowing, and this is the strongest argument against buying. In the December 2025 quarter revenue grew 20.1% from a year earlier. In the March 2026 quarter it grew 14.5%. In the June quarter it grew 12.2%, on $14.2 billion of sales. That is a run-rate of $56.8 billion, and it is still a large business growing at double digits. But a stock on 17.8 times forward earnings is priced for growth, and a slide from 20% to 12% is the kind of change that lowers what investors will pay.
The mix of the business at least is stable. In the June quarter Mobility brought in $7.4 billion, or 52% of revenue, Delivery $5.2 billion (37%) and Freight $1.6 billion (11%). If a slowdown deepens, Mobility is where it would show first, since it is half of revenue.
The risk to my reading is specific. If the September quarter shows growth near 10% and operating income flat year on year, the 2025 margin gain was a one-time step and not a trend, and the discount to sales and book value would be earned. I would change my mind on that evidence alone.
What I am not covering here: free cash flow, debt and the effect of autonomous vehicles on the ride market. The database gives me the first two only in fragments, and I do not have a measured way to size the third. Any of them could justify the discount, and the last is the one investors argue about most.
The quarter that settles it
The next report will cover the September quarter. Revenue growth of 12.2% in June is the bar. If growth comes in below 10% while operating income keeps rising, the market’s caution will look justified and the multiple has further to compress. If it holds at 12% or better and operating income keeps rising as a share of sales, the 30.9% gap to the high gets hard to defend, and the $104 average target starts to look reachable.
Gavin Thorne has invested in U.S. stocks for six years and previously worked at a large publicly traded internet company. He writes about income-oriented strategies, including cash-secured puts, and about how he reads company data. This article reflects his personal research process and is for informational purposes only. It does not constitute investment advice.
Sources: Price-to-earnings ratio (SEC Investor.gov glossary) (https://www.investor.gov/introduction-investing/investing-basics/glossary/price-earnings-pe-ratio) · How to read a company's 10-K (SEC Investor.gov) (https://www.investor.gov/introduction-investing/investing-basics/glossary/10-k)