
Broadcom’s most recent quarter was almost twice the size of the one a year earlier, and the shares fell the next day. That combination is the reason I wanted to look at this stock again, because it is what a market does when it has already paid for good news and is deciding what to do about the next installment.
Revenue was $29.6 billion, up 86%. Analysts are almost unanimous that the stock is a buy. StockVane’s own quant model grades it a D. I think both of those can be right, and the tension between them is more useful than either one alone.
The quarter that changed the size of the company
The financials tab shows how sharply the picture has turned. Quarterly revenue was $18.0 billion a year ago, then $19.3 billion, $22.2 billion and now $29.6 billion. Growth of 28%, 29%, 48% and 86% over those four quarters is not a gentle acceleration. Semiconductor solutions brought in $20.8 billion of the latest quarter and infrastructure software $8.8 billion.
Both halves of the company grew faster than a quarter earlier. Semiconductor revenue rose about 39% from the previous quarter, from $15.0 billion, and software rose about 22%, from $7.2 billion. I would not assume the software jump repeats; it is a big number for a business that had been growing steadily.
Broadcom’s own report puts AI semiconductor revenue at $16.7 billion for the quarter, up 221% from a year earlier, which is most of the increase. Our data does not split that out, but it explains the shape. A company whose software business grew steadily is now being carried by a chip business that more than tripled in a year.
It is also worth noticing how large the company has become. At a market value near $1.7 trillion it is the eighth largest stock in our data, roughly a third the size of Nvidia. A company that big growing at 86% is rare, and it is one reason the stock is being asked to justify a lot.
A profit line worth reading twice
Net income tells a stranger story. It rose from $11.5 billion in 2022 to $14.1 billion in 2023, fell 58% to $5.9 billion in 2024, and then jumped 292% to $23.1 billion in 2025. Read on its own, that looks like a collapse followed by a miracle.
Operating profit is the steadier guide. It slipped only 9% in 2024, from $16.5 billion to $15.0 billion, and then rose 74% to $26.1 billion in 2025. Most of the 2024 dip happened below the operating line, where interest, taxes and one-time items sit, and not in the core business. The 2025 figure is closer to what the company earns in a normal year, and the cash flow agrees: free cash flow was $26.9 billion in 2025, about 42% of revenue.
What the multiple is really saying
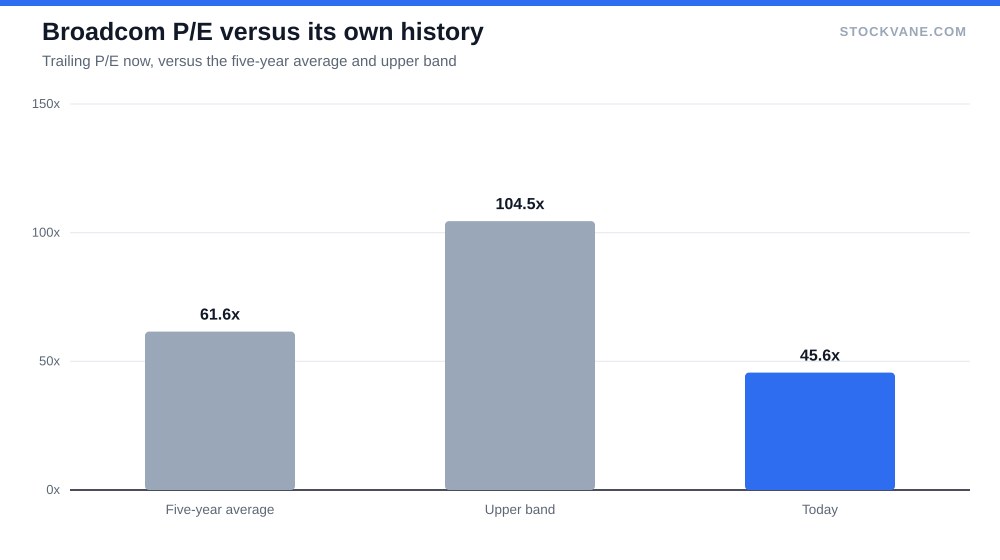
The valuation tab shows a trailing P/E of 45.6, which is actually below the five-year average of 61.6. That average is inflated by the depressed 2024 earnings, so I would not read it as a bargain. The forward P/E of 24.5 is the number to look at. It implies analysts expect earnings of about $14.6 a share over the next year, against about $7.84 of trailing earnings, nearly double.
To make that concrete, take last quarter’s revenue, multiply by four, and ask what the stock costs at different margins.
| Annual revenue run rate | At 30% net margin | At 36% net margin | At 40% net margin |
|---|---|---|---|
| $120 billion | 47x | 40x | 36x |
| $150 billion | 38x | 32x | 28x |
| $180 billion | 32x | 26x | 24x |
Last quarter’s run rate is about $118 billion a year. At the 36% net margin Broadcom earned in 2025 that puts the stock near 40 times run-rate earnings, which is an expensive number but a far more sensible one than 46 times a trailing figure that lags the business. If revenue keeps climbing toward $150 billion at a similar margin, the multiple drops to the low 30s. The stock is priced for the run rate continuing, not for a single good quarter.
What the analysts and the model disagree about
Of the 29 analysts covering Broadcom, 93% rate it a buy and none rate it a sell. The analyst consensus average target of $525 is about 47% above the current price, and even the lowest target, $400, is 12% above it.
| Metric | Value | Context |
|---|---|---|
| Price (approx.) | $357.61 | 52-week range $290 to $494 |
| P/E (TTM) | 45.6x | Five-year average 61.6x |
| Price-to-sales | 19.4x | Five-year average 15.2x |
| Analyst ratings | 93% buy, 7% hold | 29 analysts; average target $525 |
| Dividend yield | 0.71% |
The quant rating is a D, with a score of 32 out of 100 on the latest date. It was 53 twelve days earlier. A model like this does not know about VMware synergies or custom accelerators. It works from price and valuation data, and the stock is 28% below its 52-week high of $494. I do not have the model’s weights in front of me, so I cannot tell you which inputs produce a D, but the table below shows the drawdown alone does not explain it.
| Company | Quant grade (score) | Trailing P/E | From 52-week high |
|---|---|---|---|
| Broadcom (AVGO) | D (32) | 45.6x | -28% |
| Marvell (MRVL) | A (96) | 80.9x | -26% |
| Nvidia (NVDA) | C (59) | 28.1x | -6% |
| AMD (AMD) | A (97) | 143.5x | -4% |
| Micron (MU) | A (100) | 23.0x | -19% |
For contrast, the same model gives Marvell an A with a score of 96. Marvell trades at about 81 times earnings and sits well above its own average, but it has been rising, and the model rewards that. I think the honest reading is that the model measures how the stock has behaved, and the analysts measure what the business might earn. Neither is a forecast of the other.
What could slow the run rate
The risks I would keep in view are the ordinary ones for a company in this position. A small number of very large customers account for most of the AI chip growth, so one delayed program can move a quarter. Advanced chips depend on a few suppliers for manufacturing and packaging, and any shortage there caps how fast Broadcom can ship. And the software business, which has been raising prices on customers who did not choose the change, could lose some of them. None of these is a base case. Any of them could turn a quarter that looks like an acceleration into one that looks like a peak.
The table does not show a simple pattern. Marvell has pulled back about as far as Broadcom and still grades A, and Micron is 19% below its high and grades A with a perfect score. So the D on Broadcom is not just a drawdown. Something else in the model, probably how the stock has traded over other windows or where its valuation sits against its own history, is pulling the score down.
That is a reminder to treat the grade as a summary of price behavior and not as a verdict on the business. If you are deciding whether to buy a stock whose revenue nearly doubled and whose price is 28% below its high, the grade is telling you the trend is unfavorable. It is not telling you the company is weaker.
The twelve-month view
It helps to line the price up against the business. In April the shares rose about 35%, from $309 to $417 at the monthly close, and they have drifted lower since, to $358. Over the last twelve months the stock is up only about 9% from its September 2025 close of $328, while quarterly revenue has grown 86% over the same span. The business has moved much faster than the price, which is the arithmetic behind the multiple coming down and behind the sense that the stock has been standing still.
The reports have hurt
If you own this stock, the earnings reports have not been comfortable. Over the last four the shares moved -2.7%, -12.6%, +4.8% and -11.4%, and the report before that produced a 9.4% gain. The average move was about 8% in one direction or the other. Two of the last four reports came with revenue growth of 28% and 48% and still sent the stock down more than 10%. Strong growth has not protected the shares on report days.
That is worth remembering when the next one arrives. A company growing 86% has little room to surprise upward, and the reaction depends on whether the forward numbers keep the run rate believable.
How I would size it
I do not think the disagreement between the analysts and the model is a reason to avoid Broadcom. It is a reason to be honest about what you are buying. You are paying about 40 times a run rate that has to hold, for a business whose software half is steady and whose chip half has just tripled. The evidence that it can hold is real: the profit is real, the cash flow is real, and the growth is showing up in revenue and not just in slides.
But the stock has fallen more than a quarter from its high, and the two big swings after reports show how little patience the market has right now. I would want to own it at a size where a 12% single-day drop is an inconvenience and not a reason to sell. On that condition I think the analysts have the better argument on the business, and the model has the better argument on the price action. Both will be tested soon enough. The quarterly numbers are public every three months, and a stock this heavily debated does not stay unsettled for long once the next report is on the calendar.
Financial disclaimer: The content on StockVane is for educational and informational purposes only and should not be construed as professional financial advice. Stock market investing involves risk of loss.