
Investors are paying 26.6 dollars of market value for every dollar of Palo Alto Networks sales. Over the last five years the average was 13.0. The stock sits at the 98th percentile of its own price-to-sales range, and it got there in a year when GAAP profit fell 73%.
The company’s answer is platformization: sell customers a bundle instead of separate security products, give up near-term margin, and earn it back in stickier contracts. The evidence so far is half of that sentence. Sales are accelerating. The margin is not coming back yet.
My view is that the sales numbers justify the strategy but not the price, and that this is a stock where the trailing P/E of 909.0 tells you nothing while the price-to-sales ratio tells you almost everything. The rest of this piece covers why, what the market has already priced, and the number that would change my mind.
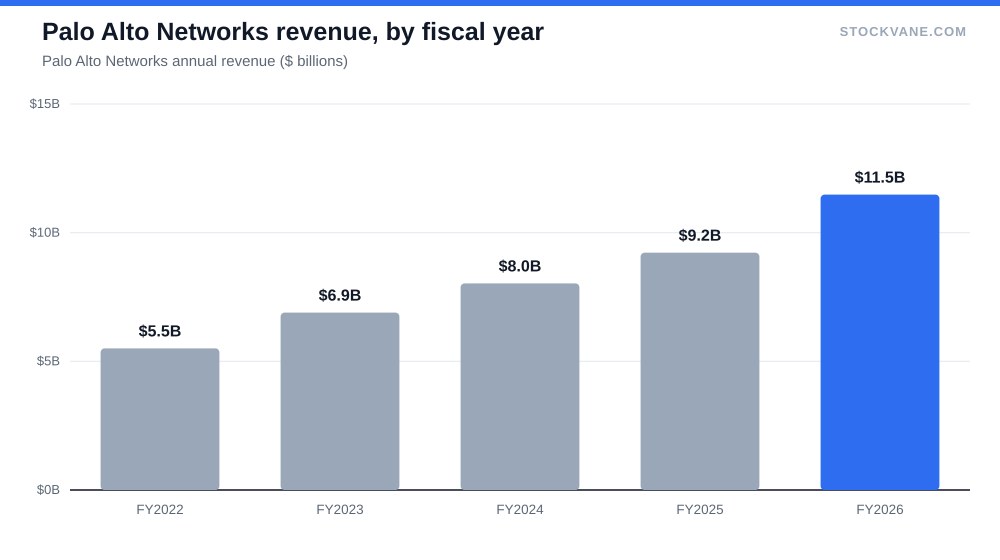
Revenue is speeding up, and profit is going the other way
Fiscal 2026 revenue was $11.5 billion, up 24%, after 15% in fiscal 2025 and 16% in fiscal 2024. The financials tab shows the full run: $4.3 billion in fiscal 2021, $5.5 billion, $6.9 billion, $8.0 billion, $9.2 billion, and now $11.5 billion. Revenue has grown 2.7 times in five years.
Quarterly figures show the acceleration better. The four latest quarters were $2.47 billion, $2.59 billion, $3.00 billion and $3.4 billion, growing 16%, 15%, 31% and 34% from the year before. The last quarter alone was 14% above the one before it. Revenue growth doubled in two quarters. That kind of jump usually has a specific cause, such as an acquisition, and our data does not tell me which one applies here, so I am not going to treat the whole 34% as organic.
Now the other side. Net income was $2.58 billion in fiscal 2024, $1.13 billion in 2025 and $0.31 billion in 2026. The drop from 2024 to 2025 was 56%, and the next year took off another 73%. Operating income tells a cleaner story: $1.24 billion in fiscal 2025 and $0.69 billion in 2026, an EBIT margin of 4.7% against 17.3%. Gross margin slipped from 73.4% to 70.4%, three points in one year.
Read that carefully. Sales rose $2.3 billion, and operating income fell $0.55 billion. All of the incremental sales, and more, went into costs. That is what a company trading margin for share looks like, and it is what a company with a cost problem looks like. The two are not distinguishable from the numbers alone.
What fiscal 2024’s $2.58 billion actually was
The trailing P/E of 909.0 and the five-year average of 169.5 are both close to noise. The average is dragged around by loss years, with a five-year band that runs from negative 386 to positive 725. A P/E that swings that widely is not measuring value.
The fiscal 2024 profit spike is part of why the later years look so bad. Operating income was only $0.68 billion that year, yet net income was $2.58 billion. A 3.8x gap between the two lines points to a large non-operating or tax item, which our data does not itemize. When a company’s earnings base has an unexplained bump in it, growth rates computed off that base mislead. The 73% decline in fiscal 2026 is partly the reverse of that bump.
Forward earnings are the more honest anchor. Analysts expect $1.52 per share, which is 279% above the trailing figure of $0.40, and the forward multiple is 239.7. That is still a very high number. It says the stock is priced for profit to grow several times over, and it says nothing yet about whether that happens.
For the same reason, I would look at the valuation tab on sales and forward earnings, not on the trailing multiple. Anyone building a model of this company on the 909 number is building on sand.
What the sales multiple is really asking for
At 26.6 times sales, on trailing revenue of $11.5 billion, the market value is $297.4 billion. Use the latest quarter annualized, $13.6 billion, and the multiple is 21.8. That is still 1.7 times the five-year average of 13.0.
Here is the arithmetic that matters. If the price stays where it is and the multiple falls back to that average of 13.0, revenue would have to roughly double, to about $23 billion. At the fiscal 2026 growth rate of 24%, that takes 3.2 years. So a buyer today is paying up front for about three years of 24% growth, with no multiple compression, to get back to a normal multiple. Slower growth stretches that timeline. A drop in the multiple shortens it, but drops the price.
I made a similar comparison for another richly valued software name in our Palantir valuation piece, and the lesson repeats here. A multiple is a promise about years of growth that have not happened yet. The current price is the market’s estimate of how many of those years are guaranteed.
The industry average price-to-sales in our data is 7.4 and the industry average forward P/E is 32.7. Palo Alto trades at more than three times the first and more than seven times the second. It is a premium franchise, and the premium is not small.
| Metric | Value | Context |
|---|---|---|
| Price (approx.) | $363.58 | 52-week range $140 to $399 |
| P/E (TTM) | 909.0x | Five-year average 169.5x |
| Price-to-sales | 26.6x | Five-year average 13.0x |
| Analyst ratings | 87% buy, 13% hold | 38 analysts; average target $415 |
A balance-sheet check on the premium
Price-to-book gives a second angle. It is 11.1 today, against a five-year average of 75.6, and it sits at the 5th percentile of its range. That looks like a bargain and it is not. The five-year book value was tiny and even negative in some periods, which is why the band runs from negative 31 to 182. The book measure has been distorted by buybacks and stock compensation, so I put no weight on it.
That leaves two usable measures, sales and forward earnings, and both say the stock is expensive against its history. Sales at 26.6 times is the 98th percentile. Forward earnings at 239.7 times is a number that only makes sense if profit multiplies. I am comfortable with the stock being expensive if the margin recovers. I am not comfortable with an expensive stock and a margin that keeps falling.
How the market has been treating the reports
Here is the odd part. The stock fell after each of its last four earnings reports: 9.3% on September 1, 5.6% in June, 6.8% in February and 7.4% in November. The average absolute move is 7.3%. And still the price is only 8.8% below its 52-week high of $399, and 160% above the low of $140.
That pattern says the market is not selling the business, it is selling the surprises in the margins. Revenue has kept climbing, and each time the market seems to have read the profit line as the disappointment. That is my reading; the data does not say why it sold. Whether the stock keeps holding up in that pattern depends on whether the margin story turns.
The analysts are patient. Of 38 covering the stock, 87% rate it a Buy and none a Sell. The average target is $415, 14% above the price, and the range runs from $346 to $475. The low target is 5% below the price, so even the most cautious analyst is nearly at the current price. Nobody in the sample is calling it cheap enough to fight for. Short interest is 2.6% of the float, and our quant grade is B today against C in early September.
If you want to see how a multiple this rich can survive on backlog and contract growth, Oracle’s backlog story is the nearest example in our coverage, though the accounting there is different.
Where I could be wrong
The bullish case has a clear form: platform customers buy more modules each year, the gross margin recovers as the bundling matures, and operating margin returns to the 17% of fiscal 2025 on much larger revenue. On $14 billion of sales, a 17% operating margin is $2.4 billion, more than three times fiscal 2026’s operating income. That would make the forward P/E of 239.7 look reasonable within two years. I cannot rule it out. The company did have a 17% EBIT margin one year ago, so the target is not exotic.
The bearish case is that the margin loss is structural. If a bundled sale needs a discount to close, and the discount grows as customers become more aware of the alternatives, the gross margin slide from 73.4% to 70.4% is the start, not the end. I also cannot rule this out. The uncertainty here is genuine and wide, and I would not size a position as if the outcome were clear.
Here is what I am not covering: product-by-product adoption numbers and customer counts. The database does not hold them, and estimates from memory would be guesses.
The margin line that has to recover
One number decides this. Gross margin was 70.4% in fiscal 2026. If the next two quarters print at or above 72%, I read the fiscal 2026 dip as a one-time cost of the transition, and the case for paying a premium gets stronger. If gross margin is still under 71% while revenue growth falls under 20%, the stock is paying a growth multiple for a business that has neither growth nor margin, and the 26.6 times sales stops making sense.
At $363.58, I would want to see that margin turn before paying more. Until then, the sales line earns the strategy credit. It does not earn the price.
Financial disclaimer: The content on StockVane is for educational and informational purposes only and should not be construed as professional financial advice. Stock market investing involves risk of loss.
Sources: Price-to-earnings ratio (SEC Investor.gov glossary) (https://www.investor.gov/introduction-investing/investing-basics/glossary/price-earnings-pe-ratio) · Stock options tax topic (IRS) (https://www.irs.gov/taxtopics/tc427)