
Between fiscal 2020 and fiscal 2025, Arista Networks grew revenue from $2.32 billion to $9.01 billion, a 3.9-fold increase. Over the same five years diluted EPS went from $0.50 to $2.75, which is 5.5 times. Earnings compounded faster than sales because the profit margin kept rising while the gross margin sat still, and that detail is the reason the stock costs 63.1 times trailing earnings today.
At $199, the shares are 7.2% below their 52-week high of $215 and 74% above the low. My view: Arista has earned a premium multiple, but the multiple already assumes the growth rate of the last four quarters holds, and that is a bigger assumption than the consensus 100% buy rating suggests.
Where the compounding comes from
Every AI training cluster needs its accelerators to exchange data at very high speed, and that traffic runs through switches. Arista sells a large share of those switches to the biggest cloud operators. The business is small in product terms, with 85.8% of the latest quarter’s revenue from hardware ($3.0 billion total, of which $2.61 billion was product and $431 million service), and simple in structure. It is not a diversified industrial.
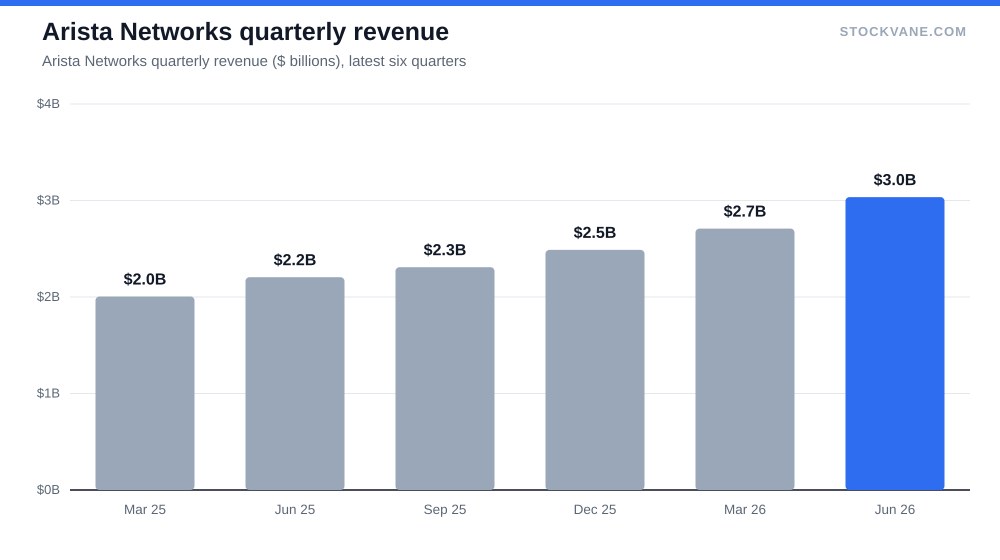
Look at the annual sequence in the financials tab. Revenue growth was 49% in 2022, 34% in 2023, 20% in 2024 and 29% in 2025. The deceleration ended in 2024 and reversed. The quarterly numbers show it more clearly: growth was 27% and 29% in the two quarters of calendar 2025 listed in the database, then 35% and 38% in the two quarters of 2026. The latest quarter, $3.0 billion, is 12% above the one before and 38% above the year-earlier quarter.
Annualized, that quarter equals $12.1 billion. That is 35% more than the fiscal 2025 total.
The margin detail that matters
Gross margin was 63.9% in fiscal 2020 and 64.1% in fiscal 2025. Flat. Nothing about pricing power or product mix has widened it, at least at the level the reported figures show. Yet the EBIT margin rose from 31.9% to 42.8% over the same stretch, and the net margin is now 39%.
So the expansion came from below the gross-profit line: operating expenses grew more slowly than revenue. Operating income was $0.70 billion in 2020 and $3.86 billion in 2025, a 5.5-fold rise against a 3.9-fold rise in sales. I read that as scale, and scale is a one-way street only while revenue keeps climbing. If growth slows to 15%, operating expenses tend to keep rising at their own pace, and the margin line stops climbing.
It also means the stock has a different sensitivity from what most people assume. It is not exposed to component costs so much as to the growth rate itself.
What the multiple is paying for
The trailing P/E of 63.1 sits at the 94th percentile of its five-year range, which runs from 35.7 to 53.0 with an average of 44.4. Today’s stock trades at 1.42 times that average. The industry average P/E in the database is 28.8. On price-to-sales, Arista carries 22.5 against its own five-year average of 15.3 and an industry average of 3.9, which puts the sales multiple near 6 times the group. Price-to-book is 16.0 against 11.7. On the valuation tab every one of these gauges is in the top decile of history.
Those are large premiums, and I do not dismiss them. The industry averages include slow-growing hardware companies that do not compound at 30%. Against a name like Palantir, Arista at least has a 39% net margin behind it.
On forward numbers the story softens. The forward P/E is 42.8, using forward EPS of $4.65, against trailing EPS of $3.16. The implied growth is 47%. That is a demanding forecast, though not an implausible one: quarterly revenue growth is at 38% and the margin structure passes most of it to profit.
What if the multiple simply reverts to average? Take the five-year average trailing P/E of 44.4 and multiply it by trailing EPS of $3.16. That gives about $140, or 30% below today’s price. Earnings would have to grow into the current price for the stock to hold its value, and the forecast $4.65 in forward EPS is the required path. If the stock keeps today’s multiple and EPS reaches that number, the price rises by the same 47%. The math works in both directions.
Reactions to reports
For a company with this record, the stock’s response to reports has been mixed. The average absolute move after the last four reports is 7.6%. In November 2025 the shares fell 8.6%, in February they rose 4.8%, in May they dropped 13.6%, and on the most recent report, August 4, they rose 3.6%.
The May drop is the one worth studying. Revenue growth in that quarter was 35% and the company was already the fastest of any quarter in the two years before it. The stock still lost more than 13% in a day. When a stock at the 90th-plus percentile of its own valuation range meets a report that is merely good, the price moves against it. The database has no news item that explains the May move, so I do not assign a cause; I use it as a measure of how little cushion the multiple leaves.
| Metric | Value | Context |
|---|---|---|
| Price (approx.) | $199.39 | 52-week range $115 to $215 |
| P/E (TTM) | 63.1x | Five-year average 44.4x |
| Price-to-sales | 22.5x | Five-year average 15.3x |
| Analyst ratings | 100% buy, 0% hold | 18 analysts; average target $246 |
Sizing the position against the risk
The stock pays no dividend, so the whole return comes from price. That changes how I would size it. A holder of a 2% yielder can wait out a bad year and be paid for it; a holder of Arista cannot. The 52-week range of $114.52 to $214.89 shows what a year can look like: the low was $115, which is 47% below the high, and anyone who bought near the top of that range needed the growth to arrive on schedule.
That range is also a reminder that the stock has already run 74% off its low. A position sized for a company that compounds at 30% is a different position from one sized for a company that compounds at 15%, and the current price does not tell you which one you own. I would rather scale in across two or three reports than commit at once, because each report resolves part of the growth question, and an entry after the next two prints costs a little upside in exchange for a lot of information.
The counter-argument is fair. Waiting has a cost in a stock that has kept beating expectations, and the last four reports show the stock moving up twice and down twice regardless of the quality of the quarter. Timing entries around them is hard, and I do not claim to do it well.
What the Street says
Eighteen analysts cover the shares and all 18 rate them a buy, an unusually one-sided record. The average target is $246, 23% above the current price. The lowest target is $215, 8% above the price, and the highest is $289, 45% above it. When even the most cautious analyst sits above the market, the target range tells me more about the sample than about the stock: a cautious analyst in this group simply does not publish.
A Goldman Sachs initiation with a Buy rating appeared in the news feed on September 9. It adds a name to the list, but it is not new information about the business.
Short interest is 1.1% of float, tiny for a stock at this valuation. Nobody is positioned against it in size. The quant rating moved from D to C over recent weeks, which reflects momentum and estimate revisions and says little about price.
What I am not covering
I am not modeling customer concentration, and that is the biggest gap. A large share of the company’s revenue comes from a small group of cloud operators, and a pause in their capital spending would hit Arista’s growth directly. The database does not quantify that exposure, so I will not put a percentage on it. The Oracle backlog post is a useful reference point for how spending commitments at large cloud buyers can be read.
I am also leaving out competition from the other switch makers and from in-house designs. Those are legitimate risks. They just are not in the data I can verify.
The print that would test 43 times
The forward P/E is 42.8. For that to be a fair price, quarterly revenue has to keep growing at 30% or better, since that pace is what turns $3.16 into $4.65. If the next report shows growth back under 30% while operating margin holds near 42.8%, the trailing multiple of 63.1 will compress, and my arithmetic above says an average multiple means roughly $140.
If growth stays above 35% for another two quarters, I would stop arguing about the multiple and start arguing about how far the growth can run. Until then the shares are a good business at a price that leaves no room for a slow quarter.
Financial disclaimer: The content on StockVane is for educational and informational purposes only and should not be construed as professional financial advice. Stock market investing involves risk of loss.
Sources: Dividends (SEC Investor.gov glossary) (https://www.investor.gov/introduction-investing/investing-basics/glossary/dividend) · Dividends tax topic (IRS) (https://www.irs.gov/taxtopics/tc404)