
Shopify kept 16.3 cents of every revenue dollar as operating profit in 2025. Amazon kept 11.2. A merchant-software company out-earning the company it once tried to imitate is a strange sentence to write, and it explains why this stock keeps splitting opinion.
The split is visible in two numbers. The quant score in our database reads D today, down from C in early September. Yet 87% of the 31 analysts covering the stock rate it a buy, with an average target of $172 against a price of $128. I think both camps are looking at the same margin line and disagreeing about what it is worth.
My view is narrower than either camp’s. The operating margin improvement is real and it is the best evidence that Shopify’s decision to stop building a fulfillment network worked. But at 86.8 times trailing earnings the shares already price a lot of that success, and the one line that got worse, gross margin, deserves more attention than it gets.
What the title claims, and what the database can prove
The title says Shopify stopped chasing Amazon and that this is why the margins work. Two halves, and they are not equally provable.
The first half is company history rather than a database field. Shopify spent heavily on its own logistics and fulfillment build-out and then sold that business, which is well documented in the company’s own filings. I take it as background and will not put a number on it that I cannot pull from our data.
The second half, that margins now work, can be measured. Operating income was a loss of $0.69 billion in FY2022 on revenue of $5.6 billion, a margin of -12.3%. It rose to $0.07 billion in FY2023 (1.0%), $1.30 billion in FY2024 (14.6%) and $1.9 billion in FY2025 (16.3%). In three years the company moved about 29 percentage points, on revenue that roughly doubled.
Cause and timing are a different matter, and that distinction is where most write-ups on this stock go soft. A margin that recovers after a restructuring gets credited to the restructuring almost by default, yet a rebound in consumer spending or a favorable payments mix could have produced some of the same lift. Our data shows the margin recovering in the years after the logistics unwind; it does not say the unwind produced it. I read the sequence as consistent with the story, not as proof of it.
Shopify against Amazon, line by line
The Amazon comparison in the title is the right one to test, so here it is. Amazon’s operating margin was 2.4% in FY2022, 10.8% in FY2024 and 11.2% in FY2025. Shopify’s was -12.3%, 14.6% and 16.3% in the same years. The Shopify figure passed Amazon’s between FY2022 and FY2024 and has stayed ahead, by 5.2 points in the latest year.
That is a fair result, with a caveat about what each margin contains. Amazon’s is diluted by a retail and logistics operation that Shopify chose not to run. AWS alone generated $42.2 billion of revenue in the June 2026 quarter, about 21% of Amazon’s total, so Amazon’s blended margin mixes a high-margin cloud business with a low-margin shipping one. Shopify’s software-and-payments mix should produce a higher margin structurally. The stock earns its higher margin the way a software company does, and that is the point.
Amazon is also growing more slowly on the top line: FY2025 revenue rose 12%, against 30% for Shopify. Its latest quarter grew 20% year over year, the fastest in the eight quarters in our data, which is a reason not to write it off as the slower business.
| | Shopify | Amazon | |—|—|—| | FY2025 revenue growth | 30% | 12% | | FY2025 operating margin | 16.3% | 11.2% | | P/E, trailing | 86.8 | 20.4 | | Analysts rating it a buy | 87% | 97% |
| Metric | Value | Context |
|---|---|---|
| Price (approx.) | $128.50 | 52-week range $94 to $182 |
| P/E (TTM) | 86.8x | Five-year average 64.1x |
| Price-to-sales | 12.6x | Five-year average 15.7x |
| Analyst ratings | 87% buy, 13% hold | 31 analysts; average target $172 |
Growth that pays for the margin
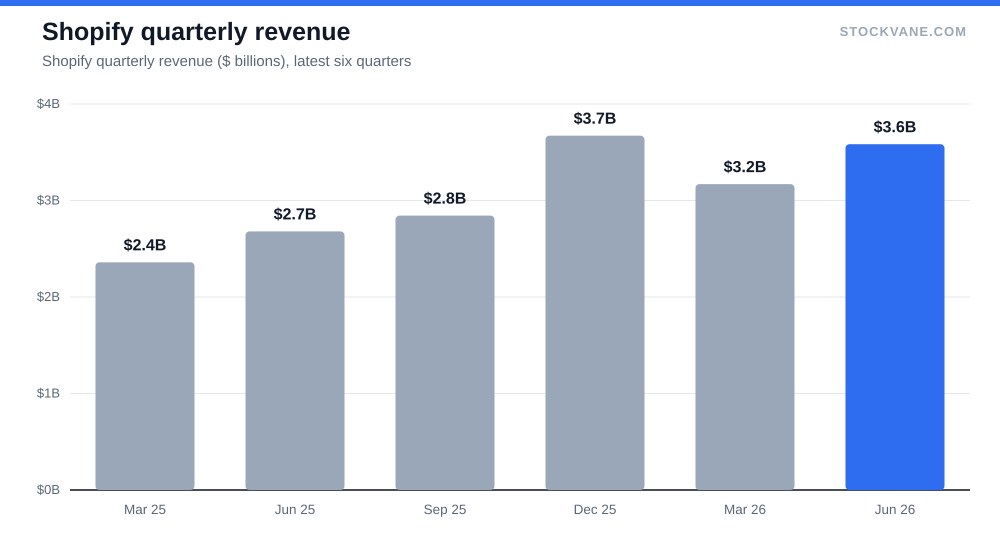
Revenue went from $5.6 billion in FY2022 to $11.6 billion in FY2025, and the growth rates ran 26%, 26% and 30% in the last three years. Acceleration into a bigger base is unusual. The latest quarter, reported August 5, brought $3.6 billion of revenue, 34% above the year-earlier quarter and 13% above the prior quarter. Annualized, that is a $14.3 billion run rate.
Operating income tells you what the growth is worth. It grew 45% in FY2025 on revenue growth of 30%. When profit grows about one and a half times as fast as sales, the cost base is doing the work, and that is what a software model should deliver.
Net income sends a muddier signal (the mechanics of separating one-off items are in our earnings-report guide), and it is the one place I would push back on a lazy reading. Net income was $2.0 billion in FY2024 and $1.2 billion in FY2025, a drop of 39%. The decline is not a business problem; the FY2024 figure, by company disclosures, included a one-off gain tied to the logistics sale, though I cannot size that gain from our database. Operating income, which rose from $1.30 billion to $1.9 billion, is the cleaner line, and I use it throughout.
The margin that got worse
Gross margin was 50.4% in FY2024 and 48.1% in FY2025, down 2.3 points in a year when operating margin rose 1.7 points. Read together, those two numbers say the company earns less on each dollar it sells and more on each dollar it keeps after operating costs. Spending discipline is producing the operating result, not pricing power.
Why does that matter? Because a margin built on cost cuts has a floor. You can only trim so much before the savings run out, and after that the margin depends on gross profit again. Shopify’s revenue mix tends to shift toward payments-related revenue as the platform processes more sales, and that revenue typically carries a lower margin than subscriptions. A mix like that pulls the blended gross margin down even when nothing has gone wrong inside either business line. I cannot split the mix from our database, so treat that as my inference, not a finding.
The counter-case is simple. If gross margin stabilizes near 48% while revenue keeps growing 25% or more, operating margin can keep expanding for several years on fixed-cost absorption alone. Both readings fit the data so far. Which one is right is decided by the next four quarters.
The price of the story
At $128 the stock sits 29.5% below its 52-week high of $182 and 37% above the low of $94. Market value is $165.3 billion. The trailing P/E of 86.8 compares with a five-year average of 64.1; the forward P/E is 76.8, using EPS of $1.67, about 13% above trailing. So the market expects profit to grow slowly next year, while paying nearly a 90-times multiple today.
Amazon’s trailing P/E is 20.4, so Shopify costs 4.3 times as much per dollar of earnings. Amazon also has the larger upside to its average analyst target, 32% against 34% for Shopify at first glance. On price-to-sales, Shopify sits at 12.6 against its own five-year average of 15.7, which is the cheaper reading, and the reason I do not call the stock expensive without qualification. The sales multiple is below history, the earnings multiple is above it. Margins are the reason: earnings are catching up to revenue, but not yet fully.
Sell-side targets range from $129 to $200, so the most cautious analyst sits 1% above the price and the most optimistic 56%. With no sells among 31 analysts, the debate is really about how much to pay. For a stock that moved +17.0% on its last report and has averaged 11.6% on earnings days, I would not treat a target as a forecast.
Short interest is 1.4% of float, so nobody is betting hard against it. That cuts both ways: it removes the squeeze risk, and it also says the skeptics have already left the room, which is the same unanimity problem the Apple bull-case post describes for a different stock.
What I am not covering
Three omissions are deliberate, and each one could change the read.
I have left out competition from other commerce platforms, because our database has no comparable data for them. I have also left out the details of the logistics sale, for the reason above. And I make no call on the currency and tax effects that sit inside the net income line.
The 50% gross margin test
The whole case comes down to whether gross margin holds near 48.1% while operating margin stays above 16%. If revenue growth stays above 25% and gross margin does not fall below 47%, the operating margin gains are durable and a premium multiple is defensible. If gross margin slips under 47% while growth falls toward 20%, the margin story was mostly cost cutting and the 86.8 multiple has nothing left to lean on. The next print, in early November, is the first real test.
Financial disclaimer: The content on StockVane is for educational and informational purposes only and should not be construed as professional financial advice. Stock market investing involves risk of loss.
Sources: Price-to-earnings ratio (SEC Investor.gov glossary) (https://www.investor.gov/introduction-investing/investing-basics/glossary/price-earnings-pe-ratio) · How to read a company's 10-K (SEC Investor.gov) (https://www.investor.gov/introduction-investing/investing-basics/glossary/10-k)