
Two semiconductor stocks, one year, one industry. Micron gained 525% between September 19, 2025 and September 18, 2026. NXP Semiconductors gained 3%. Anyone who owned the sector through a fund got something in between, and anyone who picked one of those two names got a result that had almost nothing to do with the other.
That gap of 522 percentage points is the real subject of the sector-fund question. The usual argument for a fund is that it protects you from picking wrong. My view, after running the numbers on three groups of stocks in our database, is narrower and more useful: a fund is worth most where the spread between winners and losers is widest, and the size of that spread varies enormously from one sector to the next.
How I counted
Our database holds about 300 large U.S.-listed stocks, and it tags each one with industry groups. I took three groups: 19 semiconductor stocks, 18 diversified banks, and 22 names in the global medical industry. For each stock I measured the price change from the September 19, 2025 close to the September 18, 2026 close.
Then I built two baskets from the same names, one equal-weighted and one weighted by current market value. These are calculations, not real funds. Actual sector ETFs hold more names, have their own weighting rules and charge fees, and we do not carry their price history. Treat the baskets as a fair stand-in for the shape of a sector’s returns, not a scorecard for any product.
Why three stocks? It is roughly the size of the hand a self-directed investor holds in a sector they follow. For every group I listed every possible combination of three names, gave each one equal weight, and compared its result with the basket. No cherry-picking is involved, because every combination is counted once. The output is a distribution: what a randomly chosen trio would have done, from the unlucky end to the lucky end.
Semiconductors: the loudest spread
The equal-weighted semiconductor basket rose 134%, and the market-value-weighted version rose 104%. Every one of the 19 stocks was up. Sounds like an easy year to pick anything, and it was, if your standard was making money. Against the basket, it was harder: only 7 of the 19 beat the 134% average, and the median stock returned 81%.
That gap between the average and the median is the tell. One stock, Micron at 525%, pulls the average up. Behind it came Intel and ASE at 267% each, AMD at 256%, UMC at 251% and Marvell at 230%. At the bottom were NXP at 3%, Broadcom at 4%, Qualcomm at 9% and Nvidia at 26%.
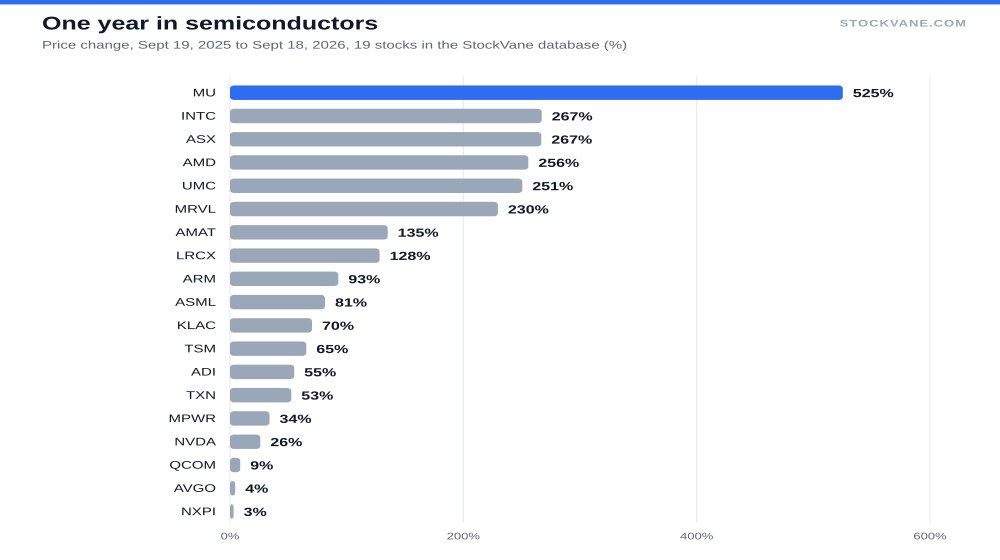
The three largest companies by market value in the group were Nvidia, TSMC and Broadcom, which returned 26%, 65% and 4%. That is why the weighted basket trailed the equal-weighted one by 30 points. A fund that weights by size puts most of its money in those three names. Owning the fund meant owning a lot of the group’s laggards. It’s a useful reminder that “the sector” can be a different bet from “the stocks in the sector”.
Now the pick test. There are 969 ways to choose three of these 19 stocks. Sorted by result, the tenth-percentile portfolio returned 48% and the ninetieth-percentile portfolio returned 236%. None lost money. Yet 42% of the three-stock portfolios beat the equal-weighted basket, and 51% trailed it by 10 points or more. So a picker in this sector had a range of outcomes that ran from a solid gain to an extraordinary one, and roughly even odds of doing better than the average. If you want a deeper look at who else is worth owning, our list of semiconductor stocks beyond Nvidia covers that side.
Six of the 19 semiconductor stocks more than tripled, and four returned less than 30%. There is no middle in that distribution to speak of. It looks like two groups, a set of companies where demand surprised on the upside and a set that simply kept pace with the market, and a picker’s job was to know which group each name would land in. I cannot say that was knowable in September 2025, and neither could the data we hold.
Banks: the quiet spread
The banks tell the opposite story. The equal-weighted basket gained 39% and the weighted one 33%. The best names, Sumitomo Mitsui and Toronto-Dominion, rose 61% each. The weakest, Wells Fargo, rose 4%. That is a range of 57 points, against 522 for semiconductors. The median was 44%, close to the average, and all 18 banks finished higher.
Choosing three of the 18 gives 816 combinations. The tenth percentile came in at 26% and the ninetieth at 51%. A total of 52% of them beat the basket, and only 14% trailed it by 10 points or more. I read this as a group where picking costs you little and rewards you little, so the argument for owning the basket is mostly about convenience. JPMorgan and Bank of America, at 13% each, were positive but trailed most of the foreign banks, and we looked at what JPMorgan’s multiple was already paying for in a separate piece.
Medical: the group where picking can hurt
Now the group where a wrong pick has a real price. The medical basket, equal-weighted, gained 19%. Weighted by size it gained 34%, because Eli Lilly (54%) and Johnson & Johnson (57%) carry so much of the value. The best stock was Merck at 84% and the worst was Boston Scientific at -56%, a 140-point range. Seventeen of the 22 stocks rose and five fell. Without Boston Scientific the equal-weighted average would have been 23%, so a single stock took four points off the group.
Of the 1,540 three-stock portfolios, 13% lost money. The tenth percentile was -3% and the ninetieth was 40%. That is the profile a diversified fund is designed for: a real chance of a bad result from a small number of picks, with a basket that pulls the outcome toward the middle. And it cuts the other way, since 52% of the three-stock portfolios beat the equal-weighted basket. Eli Lilly’s obesity-market forecast is an example of a single story that lifted a large slice of a size-weighted fund on its own.
| Group (stocks) | Equal-weighted | Weighted by size | Best stock | Worst stock | Picks that lagged by 10+ pts |
|---|---|---|---|---|---|
| Semiconductors (19) | +134% | +104% | Micron +525% | NXP +3% | 51% |
| Global medical (22) | +19% | +34% | Merck +84% | Boston Scientific -56% | 27% |
| Diversified banks (18) | +39% | +33% | Sumitomo Mitsui +61% | Wells Fargo +4% | 14% |
What the three groups say together
Line the results up. Semiconductors had a 522-point spread, banks 57 and medical 140. The share of three-stock picks that trailed the basket by 10 or more points ran 51%, 14% and 27%. The wider the spread, the more a wrong pick costs you relative to the average, and the more a fund does for you. In a narrow group like banks, the difference between owning the basket and owning three names was small enough that I would let convenience decide.
There is a second point that the averages hide. In semiconductors and in medical, the weighted basket and the equal-weighted basket gave answers 30 and 15 points apart, in opposite directions. A sector fund is a decision about weighting as well as about diversification. Read the fund’s methodology before you assume it holds what you have in mind.
A note on the practical side. Most people who ask this question hold a few positions in one sector and want to know whether to fold them into a fund. I would frame it as a spread test, not a philosophy. Look up each name’s last-twelve-month return, find the gap between the best and the worst, and compare it to the ranges above. That takes ten minutes and tells you whether your three stocks are a small bet or a large one.
What this does not show
One year is not a verdict. A period in which one memory-chip maker rose sixfold is unusual, and the semiconductor result would look very different without it. Take Micron out and the 18 remaining stocks average 113%, not 134%. Take out Intel and ASE as well and the average of the other 16 is 93%. Three stocks account for a large share of the headline. I have also not adjusted for dividends or fund fees, and the database universe covers large companies, not small ones, where dispersion is often wider still.
I am also not telling you that stock picking is a bad idea. A picker who owns the right three names in semiconductors made more than a fund did; the point is that picking the right three was close to a coin flip against the basket average. If you hold that view for reasons you can write down, as in this stock-picking checklist, you have an edge worth testing.
A rule I would use
Before you buy a second stock in a sector, look up how far apart its best and worst names have been over the last year. If the gap is under 60 points, as with the banks here, I would not worry about choosing. If it is over 100, hold the fund as the core and cap any single-stock position at a small share of the account. And check the number again in a year: the next test is whether the semiconductor spread, 522 points this time, narrows below 150.
Financial disclaimer: The content on StockVane is for educational and informational purposes only and should not be construed as professional financial advice. Stock market investing involves risk of loss.
Sources: Dividends (SEC Investor.gov glossary) (https://www.investor.gov/introduction-investing/investing-basics/glossary/dividend) · Dividends tax topic (IRS) (https://www.irs.gov/taxtopics/tc404)