
On September 4, 2025, Broadcom stock rose 9.4% the day after its earnings report. On September 2, 2026, a year later, it fell 2.7% after a quarter in which revenue grew 85.5% to $29.6 billion. The shares now trade 27.6% below their 52-week high.
That is a strange ending to an 85% growth quarter, and it is the reason I wanted to rerun this whole question with current numbers. The title asks which semiconductor stocks are worth owning beyond Nvidia. My answer is narrower than it was a year ago: Broadcom is the one name I would put next to Nvidia, because at 24.5 times forward earnings it is the only other chip stock in our coverage growing revenue above 80% without a forward multiple above 50. The others have to earn their premium quarter by quarter.
Before anyone rotates, I should deal with the awkward fact. Nvidia itself is the cheap one.
The problem with calling Nvidia expensive
Nvidia trades at 28.1 times trailing earnings and 18.1 times forward earnings, according to our valuation data. Its own five-year average is 72.7. At 0.9th percentile of that history, the stock has rarely been cheaper relative to what it earns. The latest quarter brought $96.2 billion of revenue, up 105.9% on the year, and the stock rose 8.7% on the report. It sits only 5.8% below its high.
So “beyond Nvidia” cannot be a valuation argument. Nobody should buy AMD or Broadcom on the theory that Nvidia is too expensive, because the numbers say the reverse. The argument has to be about diversification and about growth that the market is not yet paying full price for. I had that distinction fuzzy in my head a year ago, and I read the old draft of this piece with some discomfort for that reason. If you want the Nvidia case in full, my post on Nvidia’s stock forecast covers it, and the one that questioned the biggest-quarter-ever framing covers the report.
What Broadcom actually reported
Here are Broadcom’s last four quarters. Revenue went $18.0 billion, $19.3 billion, $22.2 billion, $29.6 billion, and year-over-year growth went 28.2%, 29.5%, 47.9%, 85.5%. The jump in the latest quarter was 33% over the one before it. Semiconductor solutions produced $20.8 billion of the $29.6 billion, 70.4% of the total, and infrastructure software the remaining 29.6%.
Profitability improved along with the revenue. Gross margin for fiscal 2025 was 67.8%, up from 63.0% the year before, and the EBIT margin rose from 26.9% to 40.6%. You can check both on the financials page. I would call that the part of the story most likely to survive a skeptical read: revenue grew and the business kept more of each dollar.
Now the price. Broadcom trades at 45.6 times trailing earnings, but the valuation tab shows a five-year average of 61.6, so the stock sits below its own history. The forward multiple of 24.5 compares with an industry average of 32.0. Price to sales is less generous: 19.4 against a five-year average of 15.2. I read that as the market paying up for revenue while paying less for the earnings that follow, which only works if margins hold.
Then there is the tape. The stock fell 12.6% after the June report, rose 4.8% in March, fell 11.4% in December 2025 and dropped 2.7% this month. Three of the last four earnings days were down days. That does not mean the business is weakening. It means the market has set the bar above what even an 85% quarter clears.
The comparison table
| Stock | Price | Below 52-week high | Latest quarter revenue growth | Trailing P/E | Forward P/E |
|---|---|---|---|---|---|
| NVIDIA (NVDA) | $222.27 | 5.8% | 105.9% | 28.1 | 18.1 |
| Broadcom (AVGO) | $357.61 | 27.6% | 85.5% | 45.6 | 24.5 |
| Taiwan Semiconductor (TSM) | $434.67 | 9.0% | 36.0% | 32.4 | 22.1 |
| Micron (MU) | $1,015.80 | 19.0% | 345.7% | 23.0 | 6.8 |
| AMD (AMD) | $559.82 | 4.3% | 50.1% | 143.5 | 58.6 |
| Marvell (MRVL) | $244.25 | 25.9% | 36.5% | 80.9 | 66.1 |
| Arm Holdings (ARM) | $275.61 | 39.1% | 22.4% | 281.2 | 176.4 |
Read the table from the right. Nvidia and Micron carry the lowest forward multiples, Broadcom and Taiwan Semiconductor sit in the low twenties, and AMD, Marvell and Arm start where I would want a much longer record. Micron’s 346% growth is a memory-cycle number and belongs in its own category, as I explain below.
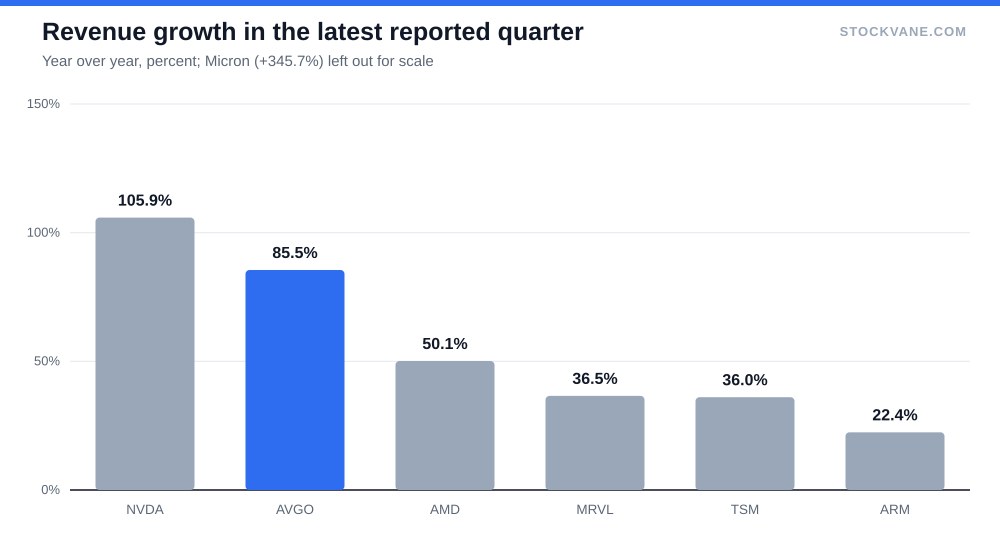
Growth is not the scarce commodity in this group. All six names in that chart grew above 20% in their latest quarter, and the cheapest of them, Nvidia, grew fastest. What varies is what the market charges for it, which is why the forward multiple, not the growth rate, does most of the sorting here.
Why AMD, Marvell and Arm cost more than the growth explains
AMD is the fairest comparison to Broadcom because both sell into the same AI budgets. AMD’s latest quarter grew 50.1%, and data center made up 58.2% of it. That is real progress. But the trailing multiple is 143.5, the forward multiple 58.6, and price to sales sits at 20.4, against a five-year average of 9.9. The forward figure is 2.4 times Broadcom’s. Growth in the fifties is a strong result that has to compound for years to justify that gap. Its earnings days show the sensitivity: down 17.3% in February, up 18.6% in May, down 7.0% in August.
Marvell is the smaller cousin. Its market value is $214 billion, roughly one eighth of Broadcom’s $1,707 billion. Fiscal 2026 revenue rose 42.1% to $8.2 billion, gross margin went from 41.3% to 51.0%, and the EBIT margin swung from -12.2% to 39.7%. That turn deserves respect. But the stock is priced at 66.1 times forward earnings, near AMD’s multiple and nearly three times Broadcom’s, and the report on August 27 sent it down 10.3%. I would want to see two more quarters before treating the improvement as durable, since a company this size can lose one large customer and see it in the next quarter.
Arm is the hardest to argue with as a business and the hardest to argue for as a purchase. Gross margin was 97.5%, and fiscal 2026 revenue grew 22.8% to $4.92 billion. The EBIT margin, however, slipped from 20.7% to 18.5%. The forward multiple is 176.4, and the stock sits 39.1% below its high, the farthest of the seven. A price that already assumes years of acceleration, from a company that grew 22% last quarter, leaves nothing for error.
The two names people forget
Two companies sit outside the custom-silicon conversation but inside any honest answer. Taiwan Semiconductor grew 36.0% in its latest quarter and trades at 22.1 times forward earnings, nearly the same multiple as Broadcom. On trailing earnings its 32.4 sits at the 83rd percentile of its five-year range, so the discount is smaller than the forward number suggests. It makes chips for many of the companies in this piece, which means owning it is a way to own the group without picking a winner. Our earlier look at ASML covers the equipment side of that supply chain.
Micron is the more dangerous one. Its latest reported quarter showed revenue up 346% to $41.5 billion, and the forward multiple of 6.8 looks like the cheapest in the group. Look at fiscal 2023 before you buy it: revenue fell 49.5% that year. A forward multiple below 7 is what the market charges for earnings it does not trust to last, and memory has a record of giving back its best years. Its next report lands September 30, and the options market implies a move of roughly 100%. I treat that figure as a measure of volatility and not a forecast of direction.
What would make the Broadcom case wrong
The risk is concrete. The valuation rests on revenue growth staying far above 50% while margins hold. If growth in the December quarter falls back toward the 30% range that Broadcom printed a year ago, the forward multiple of 24.5 would turn out to have assumed a peak. The stock is already telling us something. It fell after the strongest quarter in this group’s recent history, and the analysts’ lowest target of $400 still sits 12% above the price.
I would also flag the other side of that ledger. 29 analysts cover it, 93% rate it a buy, and the average target of $525 is 47% above the price. Consensus this one-sided has rarely been a good guide by itself, and I would rather the reader weigh the arithmetic than the headcount.
Not covered here: the customer lists that used to lead pieces like this one. I dropped them because our data does not let me verify which hyperscaler buys what, and a thesis that depends on unverifiable customer names is a weaker thesis. For the wider cycle, our AI infrastructure piece sizes the spending, and the cautious tech buying post explains why I lean toward the layer where revenue already shows up.
The forward multiple I would not pay above
My working rule for Broadcom is a forward price to earnings ratio no higher than the industry average of 32.0, which leaves it about 31% of room from here. If the next report keeps revenue growth above 50% and the stock still trades below that line, the case stands. If the multiple rises past 32 without the growth, it has stopped being the cheap way to own the trend.
Gavin Thorne has invested in U.S. stocks for six years and previously worked at a large publicly traded internet company. He writes about income-oriented strategies, including cash-secured puts, and about how he reads company data. This article reflects his personal research process and is for informational purposes only. It does not constitute investment advice.
Sources: Price-to-earnings ratio (SEC Investor.gov glossary) (https://www.investor.gov/introduction-investing/investing-basics/glossary/price-earnings-pe-ratio) · Stock options tax topic (IRS) (https://www.irs.gov/taxtopics/tc427)