
$1,152.93 buys $29.79 of trailing earnings per share in Eli Lilly today. In fiscal 2022 the same company earned $6.90 a share. Earnings per share have gone up 4.3 times in three and a half years, and the stock sits 10.8% below its 52-week high of $1,293.
The title of this post promises a forecast that keeps getting bigger. I can only partly test that from our database. It holds no history of published obesity-market estimates, so I will not repeat the widely quoted market-size figures as if I had checked them. What the database does hold is Lilly’s own reported numbers, and they are the better evidence anyway: the market forecast is an opinion, while quarterly revenue of $23.0 billion is an accounting fact. My argument is that the company’s results have run ahead of any sizing exercise for several years, that the stock’s multiple has compressed while that happened, and that the question worth asking now is what revenue the current price needs.
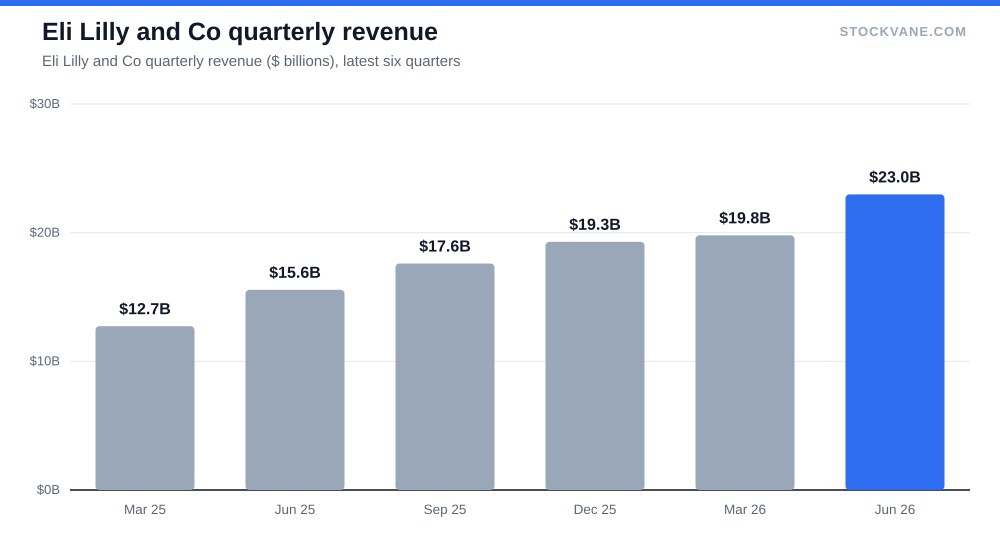
What the reported numbers show
Revenue was $28.5 billion in 2022, $34.1 billion in 2023, $45.0 billion in 2024 and $65.2 billion in 2025. Growth in fiscal 2025 was 45%, after 32% in 2024 and 20% in 2023. Companies of this size do not usually accelerate. Lilly did.
The latest quarter is bigger than the trend suggests. Revenue for the quarter ending in June was $23.0 billion, up 48% from the year before and 16% above the March quarter. The previous three quarters were $17.6 billion, $19.3 billion and $19.8 billion. Every one of the six most recent quarters grew at least 37% year on year, and two of them grew more than 50%.
Annualize the June quarter and you get $91.9 billion, against $28.5 billion for all of 2022. That run rate is my arithmetic and not a forecast. It assumes no further growth from a quarter that already grew 16% in a single step, so it is more likely to be conservative than aggressive, though a supply or pricing setback would break it.
Margins did the rest
Revenue alone would not have produced this earnings growth, as the Eli Lilly financials page shows line by line. Gross margin was 83.0% in fiscal 2025 against 81.3% the year before, and the EBIT margin was 45.6%. Operating income was $29.7 billion on $65.2 billion of sales. Net income was $20.6 billion, twice the $10.6 billion of fiscal 2024.
In the June quarter, operating profit was $12.5 billion on $23.0 billion of revenue, a margin of 54.2%. Over the last four quarters, operating profit adds up to $39.6 billion on $79.7 billion of revenue. When a business spreads fixed research and manufacturing costs over 48% more sales, margins rise faster than revenue. Fixed-cost absorption of that kind is visible in the numbers here.
There is one wrinkle. Net income in the June quarter grew 25.3% while operating profit grew 77.4%. The database does not break out why the two diverged so widely, so I will not guess. It does mean that the single-quarter EPS growth of 26.2% understates what the operating line did, and it is a reason to watch net income and operating profit side by side in the next report.
| Metric | Value | Context |
|---|---|---|
| Price (approx.) | $1,152.93 | 52-week range $708 to $1,293 |
| P/E (TTM) | 38.7x | Five-year average 67.5x |
| Price-to-sales | 13.2x | Five-year average 14.9x |
| Analyst ratings | 86% buy, 10% hold | 21 analysts; average target $1,373 |
| Dividend yield | 0.56% |
The multiple has moved the other way
Here is the piece that most surprised me. On the Eli Lilly valuation page the stock trades at 38.7 times trailing earnings. Its own five-year average is 67.5. The valuation history table, which uses a slightly different price and earnings snapshot, puts the current reading at 37.5, near the bottom of a five-year band that runs from 38.2 to 96.8, at about the fifth percentile. On forward earnings the multiple is 30.8, against an industry average of 29.3.
Read that carefully. Earnings roughly doubled in each of the last two fiscal years, and the stock did not double with them. So the market has been paying less for each dollar of profit even as the profit compounded. That is the classic sign of a market that believes the growth will fade. Forward EPS of $37.43 implies about 26% growth from the trailing figure, a sharp slowdown from the 96% posted in 2025.
On sales the picture is softer. Price to sales is 13.2, below its five-year average of 14.9 but more than double the industry average of 5.2. Lilly is not cheap on any of the measures I would normally use.
It is cheaper than its own history. That is a different claim.
I made a related point about another large-cap in Alphabet Is the Cheapest Big Tech Stock, where the headline multiple looked low until I priced the stock on operating profit. The same test applies here, and Lilly passes it better, because operating profit and net income are both growing rapidly. For a company built around a single franchise, though, the multiple is only comfortable while that growth holds.
Sizing it the other way around
Analysts size the market and then hand the company a share. The Microsoft forecast asks a similar question from the cost side, what an AI build-out has to earn back. I would rather work backwards from the price.
Say you want a 25 times multiple on trailing-style earnings at today’s price. That requires about $46.12 of EPS. Using fiscal 2025’s net income and diluted EPS, Lilly has roughly 0.90 billion diluted shares, so $46.12 a share means about $41 billion of net income. At the fiscal 2025 net margin of 32%, that needs about $131 billion of annual revenue.
The June quarter run rate is $91.9 billion. So the market is asking for roughly 43% more revenue than the run rate to justify 25 times, before any change in margin. This is arithmetic, not a target. It tells you the size of the gap the growth has to close, and whether it looks achievable depends on demand you can observe only quarter by quarter.
The cash side is thinner
Fiscal 2025 operating cash flow was $16.81 billion. Free cash flow was $5.96 billion, so capital spending took roughly $10.9 billion. Dividends paid were $5.38 billion. Free cash flow covered the dividend by only 1.1 times, though that is far better than 2023, when free cash flow was negative $3.15 billion and 2024, when it was $0.41 billion.
Cash flow lags earnings for a fast-growing manufacturer. Plants, inventory and receivables all come first. I would not call this a problem yet. It is the reason I would not describe the stock as a cash machine, and it means the dividend yield of 0.56% is a footnote and not a support.
Where analysts and price sit
The consensus among 21 analysts is bullish. 86% rate it a buy. The average target is $1,373, 19% above the price, with a high of $1,600 (39% above) and a low of $940, which is -18% from here. Even the most cautious analyst on the list sits only 18% below the stock. That is a narrow bearish tail for a name this large, and it says as much about how crowded the bullish view is as about how strong the results are.
Earnings-day moves have averaged 7.2% in either direction, and the last report on 2026-08-05 moved the stock +4.9%. Only 0.8% of the float is sold short. Nobody is fighting this stock hard. When positioning is this one-sided, a small miss gets punished more than the fundamentals deserve.
What would prove me wrong
If the bull case is right, none of this matters. The multiple just keeps compressing while earnings grow into it. My concern is narrower. A stock priced for 26% forward earnings growth has no margin for a quarter in which sequential revenue is flat. The condition that would make my caution wrong is simple: revenue above $25 billion in the September quarter, with operating margin still above 50%. That would mean the June step was not a peak.
What I have not covered is pricing pressure, competing drugs and the payer response. Those are the real long-term risks, and the database cannot measure them. I also have not modeled the size of the total market. If you want a sense of how I weigh evidence like this, How I Actually Pick Stocks sets out the process, and the Palantir valuation piece shows the same price-first method on a very different company.
The Q3 revenue line I would hold it to
Lilly reports on October 29. The September quarter of 2025 came in at $17.6 billion, so 35% growth would put the new figure near $23.8 billion. I would treat anything below $23 billion, a sequential decline from June’s $23.0 billion, as the first real evidence that the run rate overshot. A print above $25 billion, roughly 42% year-on-year growth, would mean the forward EPS of $37.43 is probably too low and the multiple is cheaper than it looks.
Gavin Thorne has invested in U.S. stocks for six years and previously worked at a large publicly traded internet company. He writes about income-oriented strategies, including cash-secured puts, and about how he reads company data. This article reflects his personal research process and is for informational purposes only. It does not constitute investment advice.
Sources: Dividends (SEC Investor.gov glossary) (https://www.investor.gov/introduction-investing/investing-basics/glossary/dividend) · Dividends tax topic (IRS) (https://www.irs.gov/taxtopics/tc404)