
Only 16 of the 300 stocks in our database yield 5% or more. That is the whole universe for an investor who wants the fastest income from individual dividend stocks, and it is small enough to inspect one name at a time.
The fund alternative is easy to describe and hard to price: a basket that screens out most of those 16. Our database holds no dividend ETFs (the four funds we carry, SPY, QQQ, DIA and IWM, report no dividend yield in the snapshot), so I cannot show you a fund’s real numbers. What we can do is build the two baskets from stock data and compare them. Our earlier comparison of high dividend yield against dividend growth covered the same tension from the growth side. The comparison here answers the question in the title, though the answer depends on what “faster” means.
My view, stated up front: buying the twenty highest yields builds the most income in year one, and it is also the version most likely to give some of it back. A screened basket earns about half as much on day one. The fund’s edge has to come from not being cut, and for most people that edge is worth the gap.
What the two baskets are
The universe is the 244 stocks of our 300 that pay a dividend, with yields from the September 18, 2026 snapshot (dividends over the trailing twelve months divided by price). The first basket takes the twenty highest yields. The second is a stand-in for a fund built on sustainability screens. It keeps stocks that yield at least 2% and pay out between 30% and 75% of trailing earnings, which leaves 74 names, equally weighted. A real fund would use growth history and earnings-quality filters as well. This is a crude version of the same idea, and the screening habits behind it are the ones I described in how I pick stocks.
I also computed the yield of the whole dividend-paying group weighted by market value, because that is what a plain index fund gets. It is 1.28%. The median payer yields 1.8%. The mean of the ten largest payers by market value is 0.4%, because Nvidia, Apple, Microsoft and their neighbors return almost nothing.
Read the chart left to right. Owning the market by weight pays 1.28%. The median stock pays 1.8%. The screened basket pays 3.2%, and the twenty highest yields pay 5.8%. Every step to the right is a deliberate decision to accept a smaller, older, more cyclical company in exchange for cash now.
The arithmetic of year one
Put $10,000 in each basket. The chase basket sends back about $579 a year, the screened basket about $316, and the market-weighted group about $128. The gap between the first two is roughly $262 a year on a $10,000 stake. For an investor adding $500 a month (the small-account guide covers how to start that habit), that gap compounds into a visible difference within three or four years.
That is the case for individual dividend stocks, and it is a fair one. A fund charges a fee, and it will not hold the pipeline or the tobacco name at the top of the table.
But a yield is a ratio. It rises when the dividend rises, and it also rises when the price falls. Some of the 5.8% is the market saying it does not believe the payment.
What the top of the yield table looks like
| Stock | Dividend yield | Payout ratio (trailing EPS) | Vs 52-week high |
|---|---|---|---|
| ITUB | 7.30% | 77% | -13% |
| MPLX | 7.04% | 87% | -2% |
| UPS | 6.62% | 100% | -15% |
| PGR | 6.51% | 72% | -11% |
| ET | 6.32% | 110% | -3% |
| PFE | 6.22% | 126% | -5% |
| PBR.A | 6.12% | 38% | -4% |
| MO | 6.10% | 103% | -8% |
| BTI | 5.84% | 70% | -16% |
| VZ | 5.81% | 69% | -7% |
Payout ratio is trailing dividend per share divided by trailing earnings per share. Above 100% means the company paid out more than it earned in the period. Of the twenty highest yields, 5 sit above 100%: Pfizer, Energy Transfer, Altria, Vale and Enbridge. BP’s ratio is so large that it reflects near-zero earnings and not a real payout, so I left it out of the count. UPS sits at almost exactly 100%.
A payout above 100% is not automatically a cut coming. Pipelines and tobacco companies often report earnings depressed by depreciation or one-offs while cash flow stays firm, and we made that distinction in our earlier piece on the same trade-off. But the ratio marks where you would have to do extra work before trusting the income.
Here is the risk arithmetic. Suppose those 5 names cut their dividends in half. The chase basket’s income falls by about 13%, which takes its yield from 5.8% to roughly 5.0%. It still beats the screened basket, so one round of cuts does not settle the argument. The edge disappears only if the basket’s income falls by 45% across the board, which would need most of the twenty to cut.
So the honest reading is narrower than “chasing yield is dangerous.” A basket of twenty high yielders can absorb a few cuts and still lead. What it cannot absorb is a price decline that arrives with the cuts.
Income is not the same as return
The screened basket holds up better in one respect and worse in another. Average distance below the 52-week high is 10.4% for the top-twenty basket, 12.9% for the screened basket and 14.7% for all 244 payers. High yielders are not, on average, deeper in the hole than the rest. That surprised me. I expected the yield chasers to look worse.
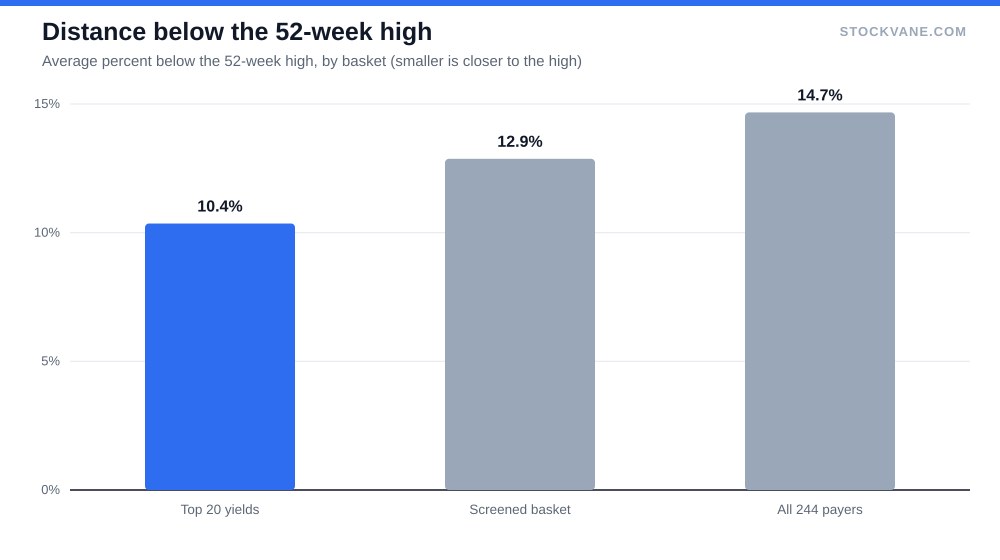
The chart is a snapshot and does not show what happened to the dividend along the way, so I would not lean on it. What it does say is that in this sample, the market has not marked down the high-yield group more than the rest. If it had, the cash in the chase basket would come with a capital loss attached, and the year-one arithmetic would flatter it.
The other side is what a screen costs. The screened basket has a 3.2% yield. That is more than double the market-weighted figure and about 1.8 times the median payer, so the screen is not giving up income in a trivial way. It gives up roughly 2.6 points against the chase basket, and it buys something specific for that price: fewer names where the dividend depends on a single bad year not arriving.
One more number frames the whole exercise. Of the 300 stocks, 70 yield less than 1%, and 59 yield 3% or more. So roughly one dividend payer in four clears 3%, and the rest carry the market’s growth stories, not its income. An investor who owns the index owns mostly the second group. That is why an ordinary index fund is a poor income tool, and why the comparison in this post is between two deliberate income choices and not between a fund and doing nothing.
Where the fund is not a fund
Two cautions on reading any of this as a verdict on dividend ETFs. First, the screened basket here is my construction. Real funds differ in their rules, some weight by yield, some by dividend growth, and each has an expense ratio that I have not modeled. Second, a fund gives you something the stock basket does not: automatic replacement. When a name fails its screen, the fund sells it and buys another. Your twenty stocks stay yours until you act.
That trade is the real question behind “which builds income faster.” A stock portfolio builds it faster if you do the monitoring. The fund builds it faster if you would otherwise hold a stock through a cut, out of inertia or hope. I know which of those describes most retail accounts, but I have no data on your behavior, so I will leave it as a question you can answer better than I can. Ask it before you buy. Then ask what the yield on your own statement looked like a year ago, because that is the only income record that counts.
Some things this comparison leaves out. It ignores taxes, since qualified and ordinary dividends are taxed differently and many high yielders are foreign or partnership structures with their own treatment. It ignores growth: a 2% yielder whose dividend rises quickly can overtake a 5% yielder that is flat in about a decade, and our data holds only trailing figures. Nor does it cover income from selling cash-secured puts, a separate route with its own risks. And it says nothing about the effect of the next five years’ rate path, which moves bond yields and, with them, the price investors pay for income.
The test I would run on any income basket
Take the yield, then divide it by two questions. What share of the names pay out more than they earn? And what happens to your total income if the weakest fifth cut by half? For the twenty highest yields today, the answers are 5 of twenty and a 13% loss of basket income. For the screened basket the first answer is zero by construction.
If the second number stays under 15% and the basket still yields at least 1.5 points more than the fund you would otherwise buy, I would hold the stocks. If either condition fails, the fund’s smaller yield is not a sacrifice. It is the cheaper way to keep the income you already have.
Financial disclaimer: The content on StockVane is for educational and informational purposes only and should not be construed as professional financial advice. Stock market investing involves risk of loss.
Sources: Dividends (SEC Investor.gov glossary) (https://www.investor.gov/introduction-investing/investing-basics/glossary/dividend) · Dividends tax topic (IRS) (https://www.irs.gov/taxtopics/tc404)