
What is a dividend worth when it can fall 53% in a single year? Blackstone shareholders found out in 2023, when the payments added up to $1.56 a share after $3.30 the year before. Two years later the same stock paid $2.69, 79% more than in 2024.
That is the pattern income investors sign up for. The quarterly payment has ranged from $0.331 (February 2024) to $0.968 (February 2026), a nearly threefold spread, on a stock that now yields 3.98% at $124.96. My view is that the swing is a feature you can price rather than a defect, and that the yield only deserves a place in an income sleeve if you size it for the years like 2023.
The rest of this note checks that claim against the payment history, the earnings record and the current price.
The payout is a formula, not a promise
Blackstone is an alternative asset manager. A large slice of what it earns comes from performance fees and realized gains on the assets it manages, which arrive when an investment is sold and not on a calendar. The firm then passes most of its distributable earnings to shareholders each quarter. Nothing smooths the number in between. A utility sets a dividend and defends it; Blackstone reports an outcome and pays it.
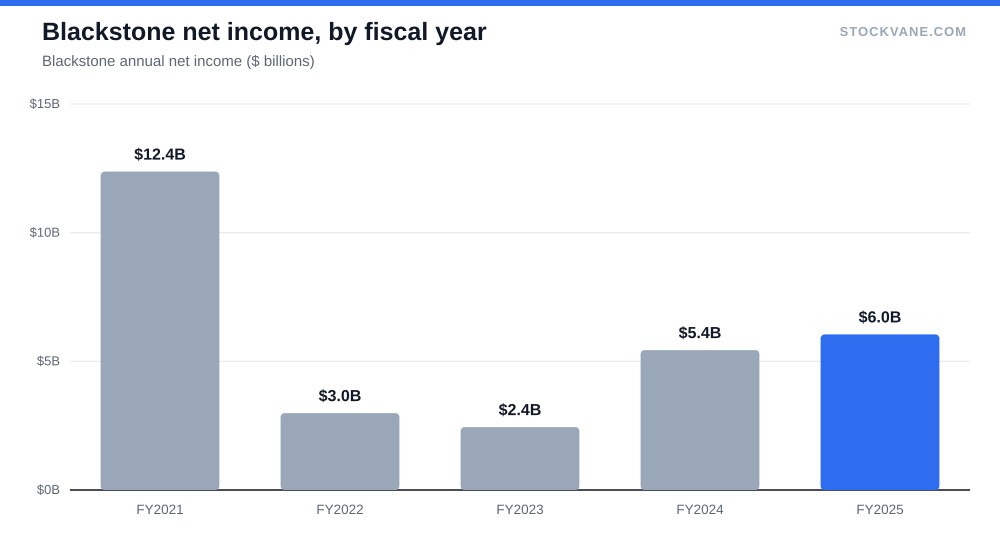
The income statement shows what feeds that outcome. Net profit was $12.37 billion in 2021, fell to $2.99 billion in 2022, slid to $2.44 billion in 2023, then recovered to $5.44 billion in 2024 and $6.05 billion in 2025. Revenue tells the same story: $16.65 billion in 2021, $7.13 billion in 2022, $7.01 billion in 2023, and $12.4 billion in 2025. Anyone who bought Blackstone for a steady raise every year bought the wrong instrument.
The dividend follows earnings, but late
A first read of the title’s claim says the dividend moves with earnings. The table below says it moves with earnings after a delay.
| Metric | Value | Context |
|---|---|---|
| Price (approx.) | $124.96 | 52-week range $100 to $183 |
| P/E (TTM) | 28.0x | Five-year average 41.8x |
| Price-to-sales | 6.2x | Five-year average 8.1x |
| Analyst ratings | 64% buy, 36% hold | 14 analysts; average target $148 |
| Dividend yield | 3.98% |
Look at 2022. Diluted EPS collapsed from $8.13 to $2.36, a 71% fall. The dividends declared that year were the largest in the table, $3.30, or 140% of the year’s EPS. That is not a payout ratio a normal company could sustain. It works here because the 2022 payments were funded by the realized gains of 2021 and the early part of 2022, and because the firm distributes distributable earnings, a non-GAAP measure that is not the same as diluted EPS. The lag is about two quarters, sometimes more.
The drop then arrived in 2023 ($1.56) and 2024 ($1.51), when payments were only 85% and 42% of EPS respectively. Investors who bought the 2022 yield paid for it in the next two years. That is the honest risk of the income case, and it is a reason I would not use Blackstone as a bond substitute.
In 2025 the two lines rejoined. The dividends were $2.69, 70% of EPS of $3.87, which sits in the middle of the range for the five years.
What the last four payments add up to
The four most recent payments are $0.968 (February 2026), $0.778 (May 2026), $0.864 (August 2026) and $0.705 (November 2025). They sum to $3.31, which is 2.7% of the $124.96 share price.
The quote page shows a different figure, a trailing dividend of $4.97 and a yield of 3.98%. I cannot reconcile the two from the database alone: $3.31 is what the four declared ex-dividend dates give, and the gap of roughly $1.65 a share may reflect how the quote feed counts distributions. When I size the position, I use the lower number. If the yield you were quoted is 4%, the yield you can verify from payments is about 2.7%.
That matters because a lower yield changes the comparison with the alternatives. My colleague’s piece on high yield versus dividend growth makes the general case that the highest payer is not always the best compounding choice. Blackstone is a special version of that argument: the yield is neither high nor growing in a straight line, but it is large in the years the firm sells assets well.
The quarterly path shows the same thing at finer grain. From $0.331 in February 2024 the payment climbed to $0.433 by October 2024, jumped to $0.867 in February 2025, dipped to $0.558 in April, then rose again to $0.968 a year later. The February payments of 2025 and 2026 were the largest of their years, but February 2024 was the smallest of its year, so there is no reliable seasonal rule to lean on. Across the five years in the table the largest single year was 2022 and the smallest 2024, a gap of $1.79 a share, or 119% more at the peak. Anyone budgeting from a single quarter will be wrong in one direction or the other. The four-payment total is the only figure worth using.
Why income investors still buy it
Because of the price. The stock trades at $124.96, 31.7% below its 52-week high of $183, and the valuation page shows a P/E of 28.0 against a five-year average of 41.8. On forward EPS of $10.78 the multiple is 11.6. The five-year P/E band runs from 19.2 to 64.3, so a reading of 28 sits at the 28th percentile of its own history. Buyers are paid a yield that is larger than the S&P 500’s on a stock that has already de-rated.
The business also has momentum. Quarterly revenue reached $4.2 billion in the second quarter of 2026, 32% above a year earlier and 39% above the first quarter. Private equity contributed the largest share of the quarter’s segment revenue, $1.70 billion or 33%, followed by real estate at $1.19 billion (23%) and credit and insurance at $0.74 billion (14%). Because performance fees are the swing factor, the dividend should follow this recovery if it holds. My reading is that the February 2026 payment of $0.968, the highest in the table’s recent history, is the first sign of it.
Analysts are cautiously positive: 64% of 14 rate it a buy and the rest hold. The average target is $148, 18% above the price, with a range of $127 to $184. The lowest target sits only 2% above the price, so the desk is not unanimous about the upside.
What I would compare it with
Blackstone’s dividend history is worth setting beside a conventional payer. Take Hewlett Packard Enterprise, a company we cover elsewhere: it declared $0.48 a share in each of 2020, 2021 and 2022 and then edged up to $0.49, $0.52 and $0.53 in 2023 to 2025. The range across those years is five cents. Blackstone’s range across 2021 to 2025 is $1.79, more than thirty times as wide. Neither pattern is better in itself. One is a contract with the shareholder, the other a share of an operating result, and the buyer has to know which one is on the ticket.
The practical consequence is on the calendar. A steady payer can be modeled a year ahead with a spreadsheet and a growth rate. For Blackstone the planning input is the fee cycle: when funds sell assets, payments rise, and when exits stall, they fall.
The counter-case
The bear argument is simple, and I take it seriously. In 2022 the payout exceeded EPS by a wide margin and the stock did not protect anyone from the decline in earnings that followed. If private-market exits slow again, performance fees vanish first, and the dividend is the line that moves. A holder who needs a fixed $5,000 a year from the position, not a fluctuating amount, has picked the wrong tool.
There is a second problem. The share price is 31.7% below its high while the yield is close to 4%, so some of today’s yield comes from the price fall and not from a higher payout. If earnings recover and the price follows, the yield will compress even as the dollar payment rises.
I am not covering the firm’s private credit exposure or its real estate fund redemptions here. Both can affect fee income, but the database has no figures on them and I would not guess. The earnings-report checklist is the place to start if you want to dig into those disclosures yourself. The last reaction to earnings, +1.4% on 2026-07-23, was small against an average move of 3.5%, which suggests the market treated the quarter as expected.
How the income actually gets used
For someone building a portfolio around income, Blackstone works best as one holding among several, next to payers with steadier declarations. Sizing it so that a 2023-type year (a 53% cut) does not disturb your budget is the discipline. Some investors also pair the stock with cash-secured puts to collect premium while waiting for a better entry; the put-selling guide explains the mechanics and the risk of being assigned shares.
Short interest is only 2.7% of the float, so this is not a crowded bearish trade, and the Quant score moved from C to E in the past few weeks. I read that as a good sign for momentum, and it says nothing about the dividend.
The November payment that decides it
The next data point is the November declaration. It replaces the $0.705 payment from a year ago in the trailing four. If it comes in at $0.90 or better, the four-payment total moves from $3.31 to $3.51, and the case for the recovery is confirmed. If it lands below the $0.705 it replaces, I would conclude that the February and May numbers were the peak of this cycle and cut my expectation for 2027 accordingly.
Financial disclaimer: The content on StockVane is for educational and informational purposes only and should not be construed as professional financial advice. Stock market investing involves risk of loss.
Sources: Dividends (SEC Investor.gov glossary) (https://www.investor.gov/introduction-investing/investing-basics/glossary/dividend) · Dividends tax topic (IRS) (https://www.irs.gov/taxtopics/tc404)