
A trailing price-to-earnings ratio of 6,254 says an investor is paying $6,254 for each dollar of profit a company earned over the past year. Nobody is really doing that. It says the profit was almost nothing, and the ratio is dividing a very large price by a very small number. CrowdStrike is the stock that produces it in our data, and the same screen also produces 49 other names above 40 times earnings.
So I sorted the whole list. Of the 300 stocks we cover, 295 report a usable P/E, and 50 of them cost more than 40 times what they earned. That is about one in six. The count matters less than what these stocks have in common, since a P/E of 45 on a company growing 30% is a different bet from a P/E of 45 on one growing 3%.
How the 300 spread out
The middle of the market is where you would expect it: the median stock with positive earnings trades at about 23 times, and the largest group, 102 stocks, sits between 15 and 25 times. Another 74 sit between 25 and 40. Below 15 there are 58, which is more than I would have guessed for a list this heavy in large technology companies. Eleven stocks have negative trailing earnings, so they have no P/E at all, and five report no figure.
Both tails are close in size, 58 cheap and 50 expensive, and that symmetry hides how different they are. Banks, oil and gas companies, telecoms and insurers fill most of the cheap side, businesses whose multiples tend to sit low for structural reasons. One part of the economy fills most of the expensive side, which I will get to. Fifty stocks at that price are collectively asking for profit that has yet to show up in the accounts.
The count depends on where you draw the line
I should be straight about the headline. It says 55, and on the September 18 snapshot I count 50 above 40 times. The reason is how thin the boundary is. Five more stocks sit between 38.7 and 40 times, Arthur J. Gallagher at 39.7, Ferrari at 39.4, Sea at 39.3, Amphenol at 38.8 and Eli Lilly at 38.7, and if the line is drawn at 38.7 instead of 40 the count is 55. Move it the other way and the list shrinks fast, to 35 names above 50 and 27 above 60.
| P/E cutoff | Stocks above it | Share of the 300 we cover |
|---|---|---|
| 25 times | 124 | 41% |
| 30 times | 92 | 31% |
| 35 times | 72 | 24% |
| 38.7 times | 55 | 18% |
| 40 times | 50 | 17% |
| 50 times | 35 | 12% |
| 60 times | 27 | 9% |
| 100 times | 12 | 4% |
Two things follow. A round-number cutoff is a convenience, so any claim that “X stocks trade above 40 times” gives a rough size, not a precise count. And the extremes are thin: only 12 stocks are above 100 times earnings, a handful of unusual cases and no broad pattern.
The most expensive names, and what the ratio hides
| Stock | Trailing P/E | Market value | Revenue growth, latest fiscal year |
|---|---|---|---|
| CrowdStrike (CRWD) | 6,254 | $243 billion | +22% |
| Palo Alto Networks (PANW) | 909 | $297 billion | +24% |
| Datadog (DDOG) | 460 | $83 billion | +28% |
| Bloom Energy (BE) | 345 | $78 billion | +37% |
| Tesla (TSLA) | 337 | $1,439 billion | -3% |
| Nebius (NBIS) | 310 | $61 billion | +479% |
| Arm Holdings (ARM) | 281 | $294 billion | +23% |
| Palantir (PLTR) | 152 | $427 billion | +56% |
| AMD (AMD) | 144 | $914 billion | +34% |
| Merck (MRK) | 117 | $362 billion | +1% |
| Welltower (WELL) | 105 | $165 billion | +36% |
| DoorDash (DASH) | 101 | $84 billion | +28% |
At the top, the ratio stops being a valuation and becomes a measure of how small a number is. CrowdStrike’s valuation tab shows trailing earnings that are tiny next to a market value of $243 billion, so the P/E lands at 6,254. Palo Alto Networks at 909 and Datadog at 460 are the same kind of case: real companies with growing revenue and thin reported profits. Tesla at 337 is a different case. Its revenue fell about 3% in its latest fiscal year, and the multiple is on top of a business that is not growing at the moment.
Above 100 times I would set the P/E aside and use price to sales or a forward multiple. When earnings sit near zero, the ratio swings on small changes: a company that adds a little profit can watch its P/E halve with no change in the business.
Two smaller cases fit the same pattern. Nebius trades at 310 times and grew revenue 479% in its latest fiscal year, which is what a business starting from a small base looks like when it begins to scale. Bloom Energy trades at 345 times and grew 37%. Neither is cheap, but at those multiples the ratio is telling you earnings are still tiny, so the number to follow is how quickly profit shows up, not the multiple today.
Growth is the test, and most of the list passes
Since a high P/E is only defensible with high growth, I checked how fast each of the 50 grew revenue in its latest fiscal year. The split was 27 names at 20% or more, 12 between 10% and 20%, and 11 below 10%.
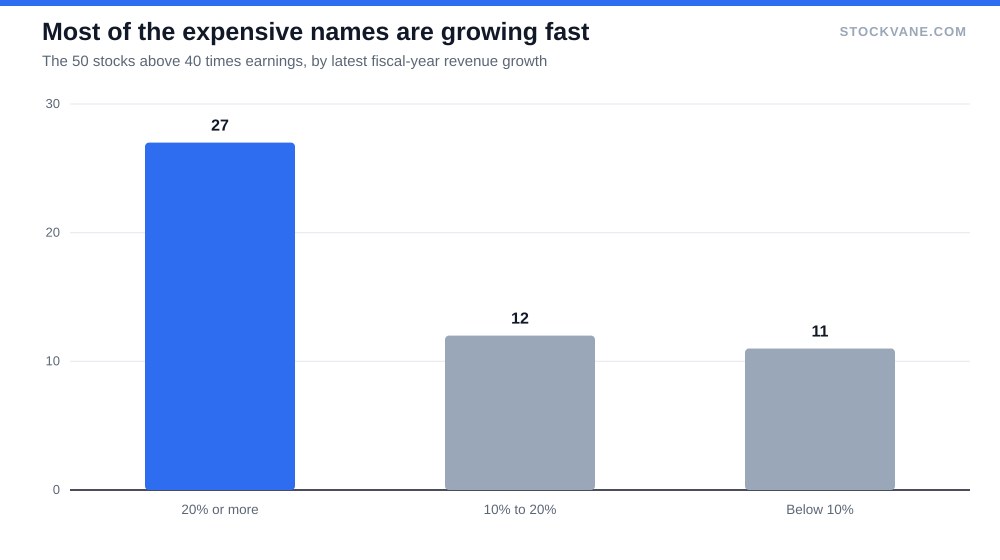
More than half grew 20% or better. That includes the usual growth names, but also some I did not expect on that list, such as Boeing, up 34%, and Welltower, up 36%. I do not want to overread this. Latest-year revenue growth is a backward-looking number, it can include acquisitions, and fiscal years end in different months. Still, it says most of the expensive names are growing quickly, and a fast-growing company at 45 times earnings is a stretched valuation, not an absurd one.
The other 11 are the ones I would look at first. Merck at 117 times grew revenue about 1%, AbbVie at 75 grew 9%, Nokia at 72 grew 3%, Starbucks at 55 grew 3%, Costco at 45 grew 8%. For companies like those, the high multiple probably reflects earnings that were held down by one-time charges, amortization or restructuring, and not a market bet on rapid growth. I cannot confirm that for each one from these numbers, and you would need the company’s filings to be sure. But if a slow grower is above 40 times, the first question should be whether the earnings are temporarily low, not whether the stock is a rocket.
What the list is made of
Technology dominates. Eight of the 50 are software companies, including CrowdStrike, Palo Alto Networks, Datadog, ServiceNow, Shopify, Synopsys, Fortinet and Cadence. Another ten are semiconductor or chip equipment makers, among them Arm, AMD, Marvell, Broadcom, ASML and Lam Research. Between them that is 18 of the 50, more than a third, while the other 32 are scattered across hardware, industrials, health care, consumer names and financial firms. Several of those 32, such as Arista, Vertiv, Corning and Quanta Services, also sell into the data center buildout, so the technology share is larger than the 18 suggests.
Then there is size. The 50 stocks above 40 times together carry about $11.9 trillion of market value, roughly 15% of the $80 trillion of the 300 stocks we cover. So the expensive group is not a fringe. It is a sizable slice of the market, and when it moves, indexes move with it. Our piece on whether the S&P 500 is overvalued asks the index-level version of this question, and this list is one reason the answer is not simple: a group that size can move an index on its own.
A few of them are cheaper than they look
The P/E on this list is trailing, which means it looks backward. Some of these companies have earnings rising so fast that the forward multiple is far lower. Broadcom is the clearest case in our data. Its trailing P/E is 45.6, and its forward P/E is 24.5, because analysts expect earnings to nearly double. Seagate and Apollo are similar, with forward multiples of roughly 21 and 17. For names like those, a screen for “above 40” catches the past, not the price you would pay today.
The opposite is also true. Some names on the list have forward multiples that are just as high as the trailing number, or higher. CrowdStrike’s forward P/E is above 1,000 in our data. That is where the growth has to do all of the work, and I would want to see the profit line turn before I paid up.
What I would do with a list like this
Start with the 11 slow growers, because that is where the risk sits. Merck, AbbVie, Nokia, Starbucks, Costco, Cintas, Hilton, Keysight, ASE, Tesla and Brookfield all trade above 40 times earnings on revenue growth below 10%, and Tesla and Brookfield saw revenue fall in their latest year. For a few of them, depressed earnings may explain the multiple. For the rest, the price assumes a re-acceleration that the latest year does not show. If the market is wrong about a group, it is more likely to be wrong about these.
The 27 that grew revenue by 20% or more are a different matter, and here I would not sell a name on the P/E alone. A stock at 45 times earnings with 30% growth and a forward multiple in the 20s, as Broadcom has, can be cheaper than a stock at 20 times with no growth. Our guide to reading an earnings report covers where to find the growth and margin figures that settle the question, and it takes about ten minutes a company.
My judgment is that the count of 50 is less alarming than it looks, and the 15% of market value it represents is the more useful number. That slice will move indexes when its growth story changes, and it will change for the slow-growth names first.
Financial disclaimer: The content on StockVane is for educational and informational purposes only and should not be construed as professional financial advice. Stock market investing involves risk of loss.