
Put Gilead’s last four quarters of earnings per share in a row: $2.43, $1.74, $1.61, and a loss of $8.45. Add them up and the trailing twelve months come to a loss of $2.67 a share. That is why the quote page shows a P/E of negative 56.6 on a stock that trades at $150.11, 3% below its 52-week high.
The number says almost nothing about the HIV franchise that produces most of Gilead’s sales. It is the fingerprint of one quarter. My view is that the negative multiple is a data artifact, that Gilead at about $150 is priced as a profitable drug company growing sales at a mid-single-digit pace, and that the risk worth arguing about is a different one: two HIV medicines account for about 61% of the revenue.
What one quarter did to the arithmetic
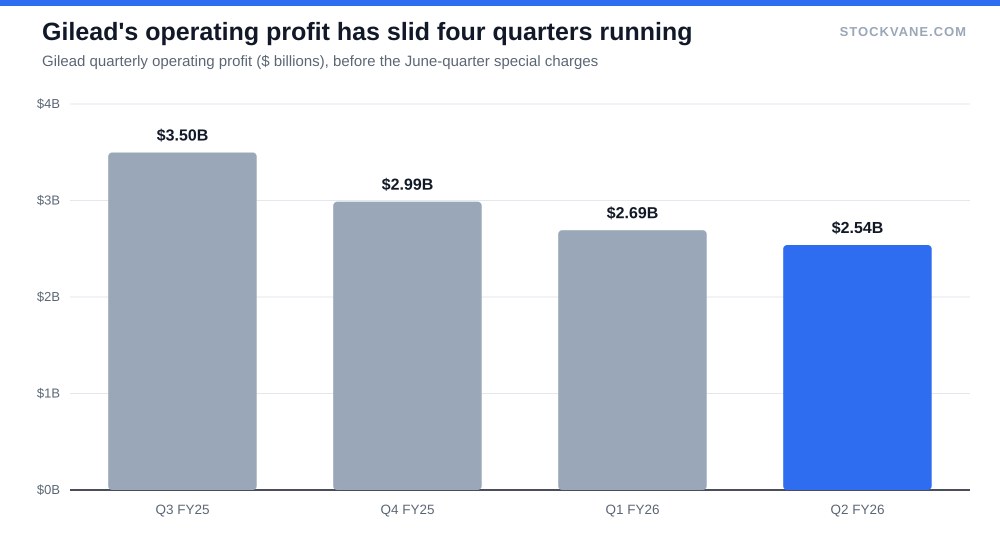
The financials tab is unusually clear about where the damage sits. In the quarter ended June 29, Gilead reported revenue of $7.80 billion, up 10.2% on the year. Operating profit was $2.54 billion. Then the income statement shows $12.9 billion of special charges, made up of $1.75 billion of impairment and $11.2 billion of what the data provider calls other special charges. Net income landed at a loss of $10.5 billion.
Those are all below-the-line items. The business that sells drugs earned a positive operating profit and the loss came from somewhere else. What I cannot tell from our data is what the $11.2 billion was. Large charges of this kind often trace to an acquisition or a written-off development program, but that is a general pattern, and the company’s filing is the place to confirm it. I would read the filing before putting real money behind any number in this post, and our guide to reading an earnings report shows where in it to look for the charge.
It is also not the first time. Gilead’s operating profit was $9.9 billion in fiscal 2020 and its net income $0.09 billion. In fiscal 2024 the figures were $10.6 billion and $0.48 billion, or $0.38 a share. Then fiscal 2025 delivered $6.78. Two of the last six fiscal years already had earnings that told you little about the core business, and now a single quarter has done it again. The gap between operating profit and net income is the first place I would look each time Gilead reports.
Two ways to get a usable multiple
There are two reasonable fixes. The first uses the last full fiscal year: $6.78 of diluted EPS puts the stock at 22.1 times. The second is cruder. Replace the June quarter with the average of the other three, which is $1.93, and trailing EPS becomes $7.71, or 19.5 times. Neither is a forecast, and both are easy to argue with. The point is that either one puts Gilead in the range of a large, profitable pharmaceutical company, not a loss-maker.
The valuation tab is less helpful. It shows a forward P/E of 60.5, which implies about $2.48 of earnings and probably still carries some of the charge. Price to book is 15.3 against a five-year average of 5.6, but the charge cut equity, so that ratio is temporarily inflated as well. Price to sales is a cleaner yardstick, and it says 6.0 against a five-year average of 4.0. I would not call that cheap. I would call it what you pay for a business that keeps 80 cents of each sales dollar as gross profit.
The table below asks a different question: what does $150 imply for different earnings levels and multiples?
| EPS Multiple | 15x earnings | 19x earnings | 22x earnings |
|---|---|---|---|
| $6.00 a share (a weaker year) | $90 | $114 | $132 |
| $7.71 a share (three-quarter average, annualized) | $116 | $146 | $170 |
| $9.00 a share (an upside case) | $135 | $171 | $198 |
At $7.71 and 19 times, the stock is worth about $146, close to where it trades. To get near the analysts’ average target of $163, you need roughly 21 times $7.71 or 18 times $9. The stock is not obviously cheap or expensive on these inputs, which is the honest reading of a company recovering from a distorted quarter.
Sixty cents of every dollar
Biktarvy alone was $3.77 billion of the latest quarter, or 48.3% of revenue. Descovy added 12.4%. Together they are 61%. The rest is a set of smaller lines: Trodelvy at 5.9%, the cell therapy Yescarta at 4.4% and the hepatitis C combination at 3.9%.
That concentration is the real risk in the stock, and it has nothing to do with the June loss. Revenue growth has been positive but modest: 3.0%, 4.7%, 4.4% and then 10.2% in the last four quarters, and the annual figures show a company that grew from $24.7 billion in fiscal 2020 to $29.4 billion in fiscal 2025, roughly 3.6% a year. A franchise that large does not need to fail to hurt the stock. It only needs to slow. Growth from the newer lines has to fill the gap, and cancer drugs at 5.9% of sales are not there yet.
The margin I would watch instead
Here is the part that runs against my own thesis. Operating profit has declined for four quarters in a row: $3.50 billion, $2.99 billion, $2.69 billion and $2.54 billion. Revenue was about flat across those quarters at $7.8 billion in the first and last, so the operating margin fell from 45% to 33%. Research and development is part of the answer, having risen from $1.35 billion to $1.76 billion, a 31% increase. Spending on the pipeline is a choice, and it may pay off. The results will not be visible for years, and in the meantime the profit that supports the $150 price is smaller than it was a year ago.
This is the counter-case, and it is stronger than the negative P/E. If the margin keeps sliding while HIV growth holds at a mid-single-digit rate, earnings could fall short of the $7.71 that the table assumes. A drop to $6 would put the stock at 25 times, a price that requires belief in the pipeline. I do not think that is the likely outcome, but I would not describe it as a tail risk either.
What the market did with the loss
The company reported on August 4, and the stock fell 2.6% that day. It then climbed. From the August 3 close of $131.15 to $150.11 on September 18, the shares gained 14%, and they are up 19% from the June month-end close of $126. I do not have a news item that explains the rally, and I will not make one up. What the tape shows is that investors did not treat the loss as a reason to sell.
The last four earnings-day moves were minus 2.6%, minus 2.0%, plus 5.8% and plus 1.1%, which is small for a large drug company and consistent with a stock that is trading more on its franchise than on any one report.
Positioning is quiet. Short interest was 1.9% of the float on August 31, with about 4.2 days needed to cover, so there is no crowded bet against the stock and no squeeze waiting to happen. The StockVane quant rating is a C with a score of 66, barely different from the C at 63 on September 8. I read that as a stock that has moved up steadily without the momentum or valuation profile the model rewards, and it fits the picture of a holding people own for stability more than for surprise.
Analysts, Morningstar and the dividend
Nineteen analysts cover Gilead: 89% rate it a buy, 11% a hold and none a sell. The average target is $163, 9% above the price, with a range of $130 to $177. Bernstein reiterated a Buy with a $160 target on September 8, only 7% higher. Barclays kept a Hold on August 14 with a $145 target, 3% below the price. The spread between them is narrow for a stock with this much distortion in its earnings.
Morningstar rates the stock two stars with a fair value of $131, and a wide economic moat. The wide moat rating rests on patent protection for the HIV regimens and dominance in hepatitis C. At $150 the stock is 15% above that fair value. A wide moat and a rich price can coexist, and I think that is the case here.
The dividend is $0.82 a quarter, up from $0.79 in December, and $3.22 over the last twelve months for a yield of 2.15%. That is 47% of last fiscal year’s EPS, or 42% of the $7.71 estimate, and about $4 billion in cash a year. Operating profit covers it nearly three times, even after the recent slide. Our piece on high yield versus dividend growth explains why a payout of this size and growth rate is more a supplement to the return than a reason to own the stock.
Paying for a franchise, not a quarter
I would not buy Gilead because its P/E is negative, and I would not avoid it for the same reason. At $150, the stock is priced for about $7.71 of earnings power at 19 times and the modest growth the HIV business has shown. That is fair. It leaves no cushion for the operating margin to keep falling.
So the next thing I would check is a single line: the operating margin in the September quarter. If it stabilizes near 33% or better, the June loss was a distortion and the stock can grind toward the average target. If it falls below 30%, I would want to know why before paying 19 times anything.
Financial disclaimer: The content on StockVane is for educational and informational purposes only and should not be construed as professional financial advice. Stock market investing involves risk of loss.
Sources: Dividends (SEC Investor.gov glossary) (https://www.investor.gov/introduction-investing/investing-basics/glossary/dividend) · Dividends tax topic (IRS) (https://www.irs.gov/taxtopics/tc404)