
Regeneron booked $2.455 billion of collaboration revenue in its June quarter. The three products it sells under its own label, Eylea HD, Eylea and Libtayo, added up to about $1.35 billion. Partner money outweighed the company’s own drug sales by nearly two to one, and that ratio is the least discussed number on the stock.
At $784.85, Regeneron trades 9% below its 52-week high and 46% above the low. My view is that the shares are fairly priced for the business as it stands today, and that the debate is about a single question: how much of the $4.29 billion quarter Regeneron gets to keep as it grows. The rest of this piece tries to size that.
What “collaboration revenue” means for the buyer
The line is 57.2% of the latest quarter’s revenue. It is money from partners who share development and commercial costs on Regeneron’s antibodies, and it does not behave like product sales. When a partner sells more of a shared drug, Regeneron’s line moves up. When a partner’s trial fails or a launch stalls, the line moves down even though nothing changed inside Regeneron’s own sales force.
That cuts two ways. The upside is risk sharing: a company that spent years on research can hold several late-stage bets without funding each one alone. The downside is visibility. From the outside, the financials tab shows one very large line and a handful of small ones, and you cannot tell how much of the large one is durable royalty-style income and how much depends on a single partner’s launch curve. I can’t tell either from the data we hold, and I would treat any confident forecast of that line with suspicion.
The own-label side is smaller and older. Eylea HD sold $596.3 million in the quarter, the original Eylea $412.2 million and Libtayo $342.6 million. Eylea HD and Eylea are both eye treatments, and the company is moving patients from the older version to the newer one, so the two figures matter as a pair, not one at a time. Together they are $1.01 billion, or about 24% of the quarter.
A growth spurt that came after a long flat spell
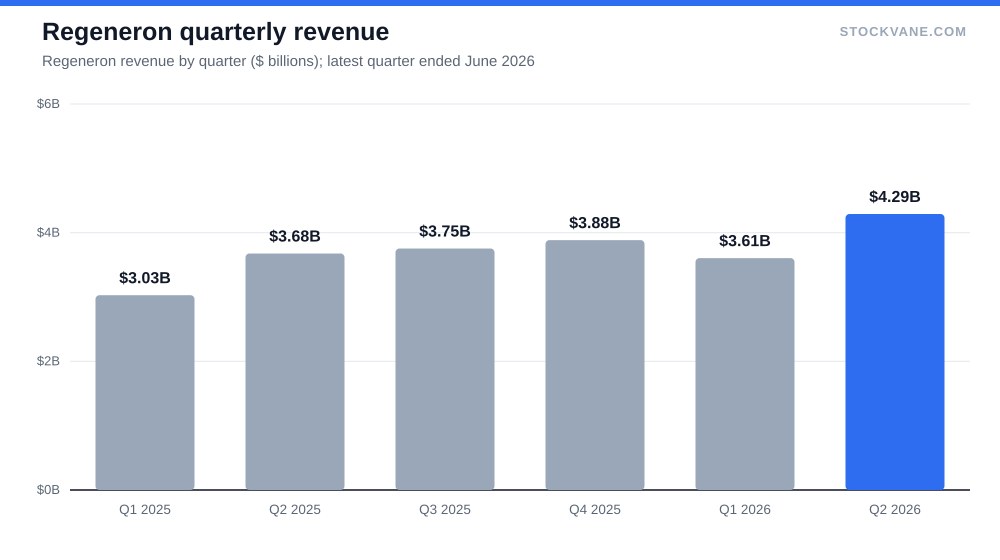
Revenue for fiscal 2025 was $14.34 billion, up 1% on the year. That followed a year of 8% growth. Quarterly sales through the second half of 2025 ran between $3.7 billion and $3.9 billion, going nowhere much. Then March came in at 19% growth and June at 17%, to $4.29 billion against $3.68 billion a year before.
A reacceleration like that is the reason the stock sits near the top of its range. It also raises the obvious question of how much is repeatable. If the jump is largely the collaboration line, then the comparison base matters, and the growth rate could fade back toward single digits once the year-ago quarters stop being easy.
Look at the deeper history for perspective. Revenue peaked at $16.07 billion in fiscal 2021. It has not regained that level since, and fiscal 2025 sits at $14.34 billion, 11% below it. Operating income tells a starker story: $8.99 billion in 2021, $4.09 billion in 2024 and $3.70 billion in 2025. Operating margin went from 56.0% to 28.8% to 25.8%. I would not treat 2021 as a normal year, so look at the closer comparison: against 2024, the operating profit fell 10% while revenue rose 1%.
So the good news of the last two quarters has to be measured against a business whose costs have been rising faster than sales for several years. Net income of $4.50 billion in fiscal 2025 was up 2%, and earnings per share of $41.48 rose 8%. The gap between those two growth rates is share count, and I read it as buybacks doing some of the work that operations did not.
The multiple asks for less than the growth suggests
The trailing P/E is 19.4. Regeneron’s own five-year average is 18.1, and the Biotechnology group is at 18.3. On the valuation tab the stock sits at the 63rd percentile of its five-year band of 11.9 to 24.2. That is a small premium to history and to peers, nothing more.
The forward multiple is where the story changes. At 13.9 times forward earnings, the price implies analysts expect about $56.3 a share over the next year, against roughly $40.4 for the trailing twelve months. That is 39% growth in per-share profit, and it is a heavy assumption. Either the collaboration income holds and costs stay flat, or the estimate is too high. For an idea of what it takes, note that fiscal 2025 EPS grew 8%.
| Forward EPS Multiple | 12x earnings | 14x earnings | 17x earnings |
|---|---|---|---|
| $48.0 a share | $576 | $672 | $816 |
| $56.3 a share | $676 | $788 | $957 |
| $60.6 a share | $727 | $848 | $1,030 |
The grid is arithmetic, not a forecast. At $56.3 and 14 times, you get about today’s price. If the forward EPS lands at $48 instead, the same 14 times gives about $672, 14% below the current quote. To reach the top analyst target of $1,030 at a 17-times multiple you need about $60.6 of earnings, and that would be a repeat of growth we have not seen in the reported data.
I would also note that price-to-sales sits at 5.2 against a five-year average of 5.9, and against 9.6 for the industry. That cheapness against the group is the strongest single argument for owning it, and it comes with the caveat that the industry average is skewed by high-growth names with tiny revenue.
Nineteen analysts and a wide range
Of the 19 analysts on the analyst page, 63% rate it a buy, 37% a hold and none a sell. The average target is $841, 7% above the price. The lowest target is $700, 11% below, and the highest is $1,030, 31% above. A 47-point spread between the extremes for a company this size tells you the analysts are not arguing about the next quarter. They are arguing about how much the pipeline is worth.
Consensus is unusually two-sided here. Nobody is bearish, but the 37% on hold is not a small camp, and the price is only 7% below the average target. That is a stock analysts respect and are not urgent about.
Short interest is low. The report dated August 31 put it at 2.5% of the float, about 3.9 days of volume to cover. Nobody is betting hard against the shares, which removes one source of squeeze-type upside and one source of downside pressure.
| Metric | Value | Context |
|---|---|---|
| Price (approx.) | $784.85 | 52-week range $538 to $859 |
| P/E (TTM) | 19.4x | Five-year average 18.1x |
| Price-to-sales | 5.2x | Five-year average 5.9x |
| Analyst ratings | 63% buy, 37% hold | 19 analysts; average target $841 |
| Dividend yield | 0.46% |
What earnings days have done to the stock
The last four reports moved the shares +6.2%, -6.2%, -1.1% and +11.8%, newest first. The average absolute move is 6.3%. Two of the four reports were losses, and the biggest gain came in October 2025. For anyone who holds through a report, a move of 6% in either direction is the working assumption. Our own volatility estimate for the next report is a range figure, not a prediction of direction. If you are new to reading reports, our earnings-report guide covers the mechanics.
The dividend does not change the picture. The yield is 0.46%, about $3.64 over the last twelve months. You are not buying this for income.
A word on how I read those moves. Two large gains and two losses in a year is not a pattern that rewards guessing. The stock rose 11.8% after the October 2025 report and then fell 6.2% after April’s, on a quarter where revenue growth was 19%. So growth alone did not decide the reaction; expectations did. That is why I care less about whether the June quarter was good and more about how much of it was already in a price sitting 9% under its high.
What the healthcare comparison misses
Investors comparing large drug names often reach for the obesity-drug story at Eli Lilly as the benchmark for growth. Regeneron is a different animal: its revenue comes from a mix of an eye franchise, a cancer drug and partner income, and there is no single product driving the model. That is a strength when one product disappoints, and a weakness because no product is big enough to carry a year of upside by itself.
I am not covering the clinical pipeline in this piece. Reading trial readouts requires expertise I do not want to fake, and the database we work from does not carry it. Treat everything above as a statement about the financial profile, not the science.
The gap I would track
The counter-case is straightforward. If collaboration revenue falls back below half of the total, either because partner sales cool or because Eylea HD grows into a larger share, the current growth rate will look like a one-off. In that case a 39% earnings jump has no support and the 13.9 forward multiple is a mirage. On the other side, if the quarter to September again shows revenue above $4.2 billion with operating income moving back up toward $1 billion a quarter, the premium to history is easy to defend.
My marker is simple. The next report needs to show revenue growth in double digits for a third quarter in a row, and it needs to show operating margin above the 25.8% of fiscal 2025. Miss both and I would treat $785 as a full price. Hit both and the forward estimate of $56.3 starts to look conservative.
Financial disclaimer: The content on StockVane is for educational and informational purposes only and should not be construed as professional financial advice. Stock market investing involves risk of loss.
Sources: Dividends (SEC Investor.gov glossary) (https://www.investor.gov/introduction-investing/investing-basics/glossary/dividend) · Dividends tax topic (IRS) (https://www.irs.gov/taxtopics/tc404)