
Abbott’s stock gets two different verdicts from two standard valuation gauges. On trailing earnings it sits at the 69th percentile of its own five-year range, a P/E of 33.2 against an average of 27.9. On sales it sits at the 6th percentile, at 3.8 times revenue against a five-year average of 4.6. One says expensive, the other says cheap, and the reason they disagree is the story of this stock.
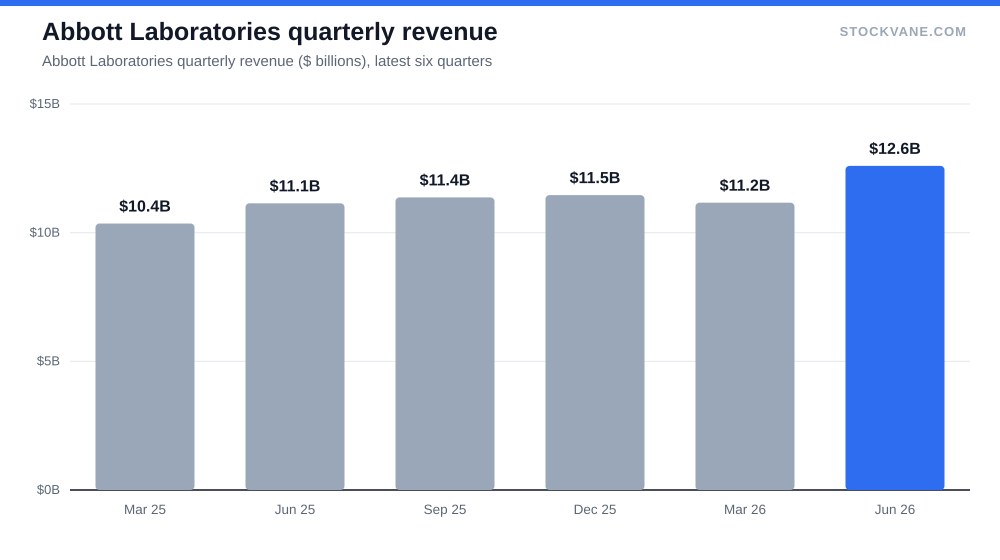
The disagreement comes from the bottom of the income statement. Revenue in the June quarter came in at $12.6 billion, up 13% from a year earlier, while reported diluted EPS was $0.53, down 47.5%. Sales are rising and earnings per share are collapsing at the same time, and the price at $102.61 is 23.6% under its 52-week high of $134.
I think the sales gauge is the better guide right now, and the earnings gauge is being distorted by a one-off comparison. That is an inference, not something the data confirms, and I will say where it could fail. Every one of the 15 analysts in our data rates the stock a Buy, with an average target of $124, 21% above today’s price.
Why a 47% EPS drop can sit next to 13% revenue growth
Start with the annual figures on the financials tab. Net income was $13.4 billion in fiscal 2024, up 134%, and then $6.5 billion in 2025, down 51%. Revenue over the same two years went from $42.0 billion to $44.3 billion, a gain of 6%. A business does not double its profit and then halve it. Not while sales move 6%. Something outside the operating business produced the 2024 spike, and the 2025 and 2026 comparisons are still working through it.
Operating income tells a cleaner story. It was $6.8 billion in fiscal 2024 and $8.1 billion in 2025, an operating margin of 18%, versus roughly 16% in 2024. The operating line rose while net income fell by half. That gap, about $1.2 billion of operating improvement against a $6.9 billion fall in net income, has to sit below the operating line: taxes, investment gains, or one-time charges. Our database does not break those out, and I will not guess which.
So the quarter’s $0.53 needs a warning label. Reported EPS in the March quarter was $0.61, down 19.7%, and the June quarter’s 47.5% fall is the second big drop in a row. If those two numbers were pure operating weakness, revenue could not be growing 13%. Before trusting the trailing multiple, read the adjusted EPS reconciliation in the company’s own release. Five minutes. It changes the multiple you should be using. For anyone new to that document, our guide to reading an earnings report covers where the reconciliation sits.
The revenue line is better than it looks
Quarterly revenue has run at $11.4 billion, $11.5 billion, $11.2 billion and then $12.6 billion over the last four reports, with year-over-year growth of 7%, 4%, 8% and 13%. The June figure is a 13% sequential jump too, from $11.16 billion. That is large for a company with a $177.6 billion market value, and it is the fastest quarter in the run.
The mix matters for how durable it is. Medical devices were $5.85 billion of the June quarter, 46.5% of sales. Diagnostics were $3.09 billion, or 24.6%. Nutrition was $2.14 billion, 17.0%, and established pharmaceuticals $1.50 billion, 11.9%. No single line is more than half the company, which is the point of owning Abbott instead of a pure device maker. A soft quarter in nutrition does not sink the year.
Gross margin is the other line worth a look. It was 56.4% in fiscal 2025 against 55.4% the year before, an improvement of one point. That is not the profile of a company buying growth with price cuts.
The quarterly run-rate of $50.4 billion annualized is 14% above fiscal 2025 revenue of $44.3 billion. If the June quarter is representative, next year’s revenue is already higher than the last full year by a wide margin. If it includes timing benefits, the figure comes down. One quarter is not a trend.
Four years of flat sales explain the skepticism
Here is the number that cools the enthusiasm. Revenue was $43.1 billion in fiscal 2021 and $44.3 billion in fiscal 2025. That is roughly 3% growth in four years, with a dip to $40.1 billion in 2023 in between. The pandemic testing business inflated the early figures, and its fade cost the company about $3 billion of sales before the base rebuilt. A 13% quarter looks like a break from that pattern, and the market has seen breaks before.
Compare that with the price-to-book ratio, which is 3.5 today against a five-year average of 4.9, a percentile of 7. Investors have taken roughly a quarter off the premium they paid for the balance sheet. Price-to-sales tells the same story, 3.8 against 4.6. So the stock has already de-rated on two of three measures, and only the earnings measure looks stretched, because the earnings figure is the one with the noise in it.
That is why I keep returning to the base-effect reading. If the de-rating on sales and book value were the full picture, I would call the shares fairly priced for a low-growth compounder and move on. The 47% EPS drop is what makes the case interesting, because it is either a mirage or a warning, and the next report is the first that can tell which.
The market has not believed it
Look at what the stock did on the last four earnings days: up 10.7% in July, then down 6.0% in April, down 10.0% in January, and down 2.4% in October. Three drops in four reports. Not a friendly record. The July jump is the only win. It recovered less than the earlier losses had taken.
The average absolute move on earnings day in our data is 7.3%. That is the size of the swing to expect on the next print in either direction, not a forecast of direction. A stock that has moved 7% on the average report and sits 24% under its high is priced for skepticism, and skepticism is the reason the price is where it is.
The valuation is the other half of that skepticism. At 33.2 times trailing earnings, Abbott trades 19% above its own five-year average and well above the 26.4 average for its medical devices group. On forward estimates the multiple is 23.9, based on forward EPS of $4.30. That forward figure implies 39% growth from the trailing base. The valuation tab shows the same picture.
| Metric | Value | Context |
|---|---|---|
| Price (approx.) | $102.61 | 52-week range $81 to $134 |
| P/E (TTM) | 33.2x | Five-year average 27.9x |
| Price-to-sales | 3.8x | Five-year average 4.6x |
| Analyst ratings | 100% buy, 0% hold | 15 analysts; average target $124 |
| Dividend yield | 2.38% |
Investors who want a peer for how markets treat a healthcare name after an earnings shock can compare UnitedHealth’s margin story. The mechanics differ, but the pattern of a multiple set by one messy line does repeat.
What could make me wrong
The bullish reading depends on the earnings gap being a base effect. If the 2024 profit was inflated by a one-time item, the 2025 and 2026 declines are just the comparison unwinding, and the forward EPS of $4.30 is the number to trust. But if adjusted EPS is also falling, with the operating margin sliding as well, then the stock deserves the discount and a 33 times trailing multiple is expensive.
The analyst count is a weaker signal than it looks. All 15 rate it a Buy, but the range of targets runs from $112 to $135. The low end is 9% above the price and the high end is 32% above. A unanimous rating with a nine-percent floor is less of a call than it sounds. Buy ratings are cheap in a stable, dividend-paying company, and they rarely change until the price does.
The dividend is real. It comes to 2.38% or $2.44 per share over twelve months. It gives a holder something while the earnings question is resolved. It does not make the stock cheap. At 33.2 times trailing earnings, a 2.4% yield is a small cushion, not a valuation argument.
Short interest is only 1.3% of the float, so nobody is betting hard against the story. Our quant grade is E today against C in early September, so the model is not endorsing the analysts’ unanimity.
What the next report has to show
The next quarter’s report, if timing follows last year’s mid-October pattern, needs to answer one question. Forward EPS of $4.30 works out to about $1.07 a quarter. Reported EPS was $0.53 in June and $0.61 in March, roughly half of that pace. If the September quarter prints near $0.55 again with double-digit sales growth, the gap is structural, the sales gauge has been too generous, and the Buy ratings are stale.
Now the other case. A print above $0.80 with revenue growth above 8% would say something different. It would say the 2024 comparison is the culprit, that the forward multiple of 23.9 is the fair one to use, and that the stock is cheap against its own sales history. That is the threshold I would hold Abbott to: 80 cents and 8% growth, both.
Financial disclaimer: The content on StockVane is for educational and informational purposes only and should not be construed as professional financial advice. Stock market investing involves risk of loss.
Sources: Dividends (SEC Investor.gov glossary) (https://www.investor.gov/introduction-investing/investing-basics/glossary/dividend) · Dividends tax topic (IRS) (https://www.irs.gov/taxtopics/tc404)