
Ask what AbbVie earns per share and you get two answers. The trailing figure in our data works out to $3.54. The forward figure implied by the stock’s forward P/E is about $10.25. Same company, same year, a gap of nearly three times. Which number you believe decides whether 74.6 times earnings is an alarm or an accounting artifact, and I think it is closer to the second.
The story behind it is the one the bulls tell, and for once it is mostly true. AbbVie lost US exclusivity on Humira in 2023, and Humira had been the best-selling drug in the world, at roughly $20 billion a year at its peak (an approximate figure from public reports, not from our database). Then revenue fell 6% in one year, from $58.1 billion to $54.3 billion, and never fell again. By fiscal 2025 it was $61.2 billion, above where it started.
The cliff, in the revenue line
The financials tab shows how small the dip was for a loss of that size. Revenue went from $58.1 billion in 2022 to $54.3 billion in 2023, then to $56.3 billion in 2024 and $61.2 billion in 2025, up 9% in the latest year. Operating income tells a sharper version: $13.5 billion in 2023, $11.9 billion in 2024 and $20.1 billion in 2025. That is an operating margin that went from 25% to 21% and then to 33%.
Gross margin gives a second angle. It was 62.4% in 2023, the trough year, and 70.2% in 2025, a recovery of almost eight points on a larger revenue base. Newer drugs with strong pricing carry that improvement, and it is the reason operating income rose 69% in 2025 on sales growth of 9%. A company that wins on both volume and mix produces profit that outruns sales, and that is rarer than the headline growth rate suggests.
So the cliff cost about a year. It did not cost a decade. The quarterly numbers agree: the most recent quarter brought $16.99 billion, up 10% on the year, after $15.00 billion, up 12%, the quarter before it. Growth in the low double digits, at this size, is not a recovery story anymore.
Two drugs did the replacing
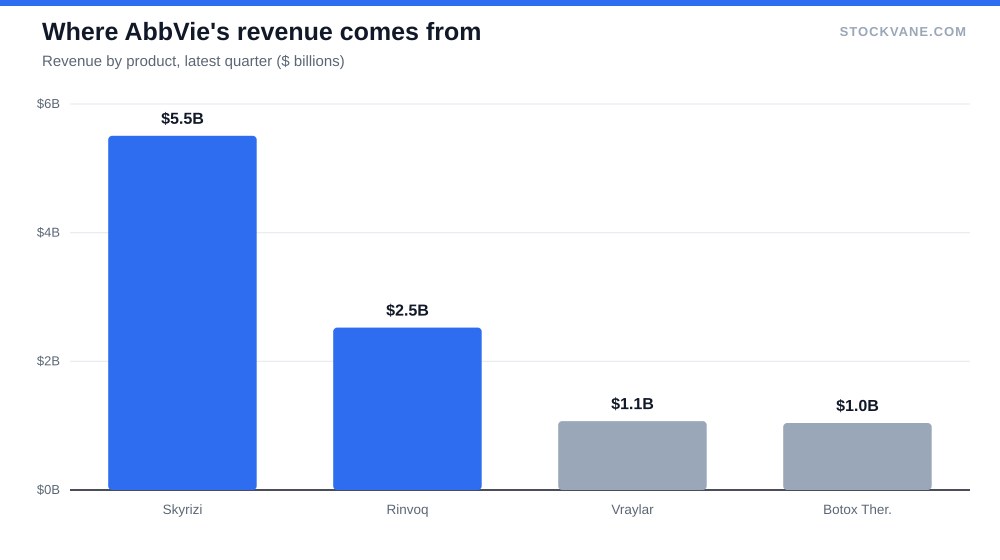
Skyrizi sold $5.5 billion in the latest quarter, and Rinvoq $2.5 billion. Together that is $8.03 billion, or 47% of the company’s revenue in that quarter, and an annualized pace of about $32 billion. Vraylar and Botox Therapeutic each add roughly $1 billion a quarter, at $1.07 billion and $1.04 billion.
The concentration is the point. Nearly half of quarterly sales now come from two immunology drugs, which is the same kind of exposure that hurt the company when one product carried it. I don’t say that to pick a fight. Replacing one cliff with a smaller, later one is a legitimate trade. It also means the next patent question is already on the calendar, and the company will have to answer it with pipeline or with acquisitions. Our news feed shows an item from September 4 on Apogee Therapeutics now sitting under the AbbVie ticker, which I read as a sign that the company is still shopping, though I have no detail on terms.
The counterweight to all this is scale. Growing another 10% from $61.2 billion means adding about $6 billion of sales in a year, and most of that has to come from the same two drugs. The 2023 decline showed what happens when one product turns; the next test is whether two products can keep expanding as fast as the single one once did. I don’t have data on their patent timelines or competitor pipelines, so I treat the current growth as a strong base and not a guarantee.
Why the P/E looks wrong
Now back to the two earnings numbers. Net income in 2025 was $4.23 billion, against $11.85 billion in 2022, a fall of 64% while sales rose about 5%. Diluted EPS went from $6.63 to $2.37. Operating income, remember, is up from $18.8 billion to $20.1 billion over the same span.
Something sits between operating income and net income, and it is large. I can see the gap in our data but I cannot break it down, so I will not name the items. It is common for drug companies to pay for acquired research and to carry heavy interest costs after big deals, and forward estimates usually leave some of those out. That is my reading of why the forward EPS of $10.25 sits so far above the trailing $3.54. It is an inference, and if the charges recur every year, the forward figure is too generous.
The valuation tab puts the trailing P/E at 74.6, against a five-year average of 58.7, and the forward P/E at 25.7, against an industry figure of 29.3. Price-to-sales is cleaner. It stands at 7.1, above the five-year average of 5.4 and the industry’s 5.2, and in the 97th percentile of the stock’s own history. On sales, AbbVie is expensive.
Price-to-book is negative, near -77. After years of buybacks and dividends the book value went below zero, so the ratio says nothing useful. Anyone quoting it as a valuation signal has not looked.
What the market has done with the report days
The last four reports moved the stock -2.5%, +3.1%, -3.8% and -4.5%. Three of the four were declines. In each of them the company was growing revenue near 10%, and the stock still went the wrong way, which is a sign that the good news was already in the price by report day.
The price is now $263.96, within 1.3% of the 52-week high of $267 and 39% above the low of $189. The dividend yield is 2.55%. Nobody is buying AbbVie for the yield at that level, which leaves price appreciation as the only real reason to hold it, and that puts more weight on the multiple than on the payout. A 2.55% cash return does not cushion a 20% pullback for long.
Analysts see 8% and a model sees a C
Of 22 analysts, 86% rate it a buy and the rest a hold. The analyst page shows an average target of $284, about 8% above the price. The high target is $315, 19% up. The low target, $244, is 8% below the current price. When a buy-rated stock has a lowest target under the price, the room left is not large.
Our quant model rates AbbVie a C at 50, down from a C at 62 on September 8. A C is middle of the pack. It says the stock is neither broken nor cheap, and the trend in the score is a small mark against the chase.
| Metric | Value | Context |
|---|---|---|
| Price (approx.) | $263.96 | 52-week range $189 to $267 |
| P/E (TTM) | 74.6x | Five-year average 58.7x |
| Price-to-sales | 7.1x | Five-year average 5.4x |
| Analyst ratings | 86% buy, 14% hold | 22 analysts; average target $284 |
| Dividend yield | 2.55% |
The counter-case
The bear argument has two legs. First, Skyrizi and Rinvoq carry almost half of sales, so any pricing pressure or a competing drug in immunology hits the company harder than it would hit a diversified peer. Second, the earnings gap could persist. If what separates operating income from net income does not go away, then the market is paying 25.7 times an earnings figure that never arrives, and the multiple compresses even if sales keep growing.
I would not call either likely. But a 4.4-day short interest cover and a 1.1% short float mean nobody is positioned for it either. The absence of shorts is not evidence that the risks are small.
A price grid
A grid is more honest than a target here, because the earnings base is the disputed part. At the $10.25 forward figure, 15 times earnings gives $154, 20 times gives $205 and 25 times gives $256. The current price is 25.7 times. It sits at the top of that range, and every dollar above $256 has to be paid for by growth I cannot see in the numbers.
| Forward EPS Multiple | 15x earnings | 20x earnings | 25x earnings |
|---|---|---|---|
| $8.50 a share | $128 | $170 | $212 |
| $10.25 a share | $154 | $205 | $256 |
| $11.50 a share | $172 | $230 | $288 |
The eye goes to the top-right corner. That is where AbbVie is priced today, and it is the version of the grid in which the company’s forward earnings arrive in full and the market rewards them at a multiple close to the industry average. I would not chase it there.
The price at which I stop arguing
My view has two parts and I hold them at different confidence levels. On the business, I am fairly sure: the transition worked, and the 33% operating margin proves the replacement products are profitable, not just large. On the price, I am much less sure, because the whole valuation hangs on one earnings number I cannot verify from outside.
I respect the cliff survival. The company saw the risk a decade ahead and paid for the replacement in time, and the numbers show it. What I cannot do is pay 25.7 times a forward figure that is nearly three times the trailing one and call it a bargain. My rule here is simple. If the stock falls toward $205, 20 times the forward figure and about 22% below today’s price, I would start buying and stop arguing. Above $256, I would wait for the company to show the gap between operating income and net income narrowing in a report. For a guide to reading that kind of gap, our earnings report primer covers where to look.
Financial disclaimer: The content on StockVane is for educational and informational purposes only and should not be construed as professional financial advice. Stock market investing involves risk of loss.
Sources: Dividends (SEC Investor.gov glossary) (https://www.investor.gov/introduction-investing/investing-basics/glossary/dividend) · Dividends tax topic (IRS) (https://www.irs.gov/taxtopics/tc404)