
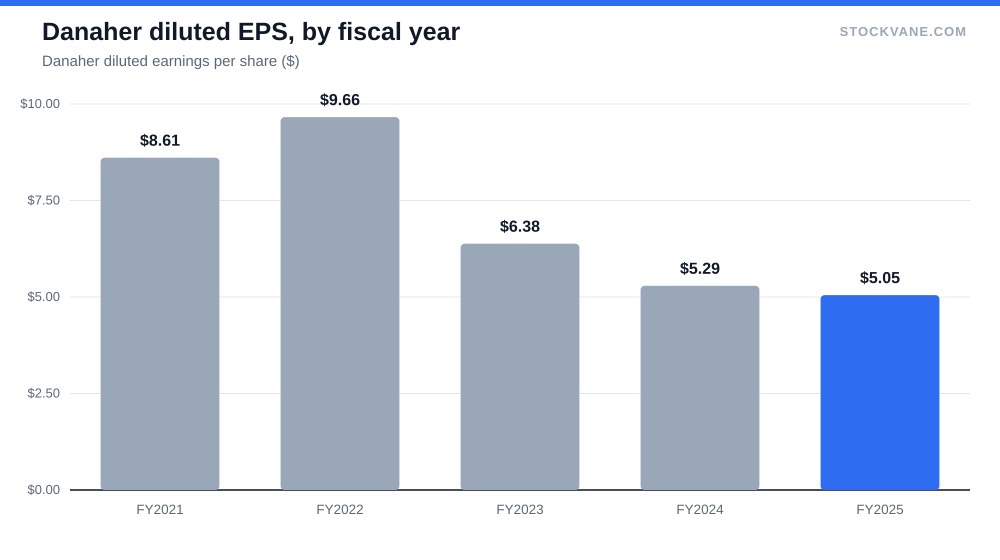
Danaher earned $9.66 a share in 2022. In 2025 it earned $5.05. Over those same three years the stock’s multiple barely moved: 37.6 times trailing earnings today against a five-year average of 36.3. When earnings drop 48% and the multiple stays put, the price has to have been carried by something other than results. I want to know what.
The last report made the question sharper. Danaher fell 11.0% on July 21, the largest reaction of its last four reports, and at $211.81 it still sits 12% below its 52-week high of $241.78. My view is that the market is paying a full price for a recovery that has started in revenue and has not yet shown up in margins, and that the price is fair only if the forward earnings estimate proves right. I will lay out the evidence for both halves of that sentence.
Half the earnings, the same multiple
The financials tab shows revenue of $26.6 billion in 2022 and $24.6 billion in 2025, a decline of 8%. Operating income fell much faster, from $7.54 billion to $4.69 billion, or 38%, which took the operating margin from 28% to 19%. Gross margin barely moved, 60% then and 59% now, so the squeeze happened below the gross profit line. I cannot tell you from our data which expense lines did it.
Net income tells the same story at full size: $7.21 billion in 2022 and $3.61 billion in 2025. Diluted EPS slid from $9.66 to $6.38, then $5.29, then $5.05.
None of that says Danaher is a broken business. It says the pandemic-era peak for testing and bioprocessing demand has passed, and the company has spent three years digesting that. Revenue was flat in 2024 at $23.9 billion and grew 3% in 2025. The direction has turned. The question is how fast profit follows.
What the July quarter said
Second-quarter revenue was $6.3 billion, up 6% from a year earlier. Net income was $0.87 billion, up 57%. On its face that is a strong report, and the stock fell 11%.
Look one line further. Net margin was 13.9% in the quarter, against 17.3% in the first quarter, when revenue was $5.95 billion and profit $1.03 billion. Sequentially, profit fell 15% while sales rose 5%. The 57% year-on-year gain flatters the picture because the base was weak: the second quarter of 2025 earned only $0.56 billion, a net margin of 9.3%. Compared with a normal quarter, this one was a step back.
I do not have the earnings call or any news item that explains the drop, so I will not assign a reason. What the numbers allow me to say is that revenue growth of 3% to 6% in each of the last five quarters has not been enough to stop net margin from slipping to 13.9%.
The segments are balanced. Diagnostics brought in $2.47 billion, 39% of the quarter, Biotechnology $1.92 billion and Life Sciences $1.88 billion. No single unit rescues a bad quarter, which is one reason the reaction was so large: there was nowhere to hide the margin miss.
Paying 37.6 times for what
On the valuation tab, the trailing P/E of 37.6 sits at the 50th percentile of Danaher’s own five-year range, which ran from 29.2 to 43.4. The industry average is 36.5. So relative to its history and to its group, Danaher is average, and average here means expensive in absolute terms.
The forward P/E is 32.2, which implies analysts expect about $6.58 a share over the next twelve months. Trailing earnings work out to about $5.63. That is a 17% gain over the trailing figure and 30% over fiscal 2025’s $5.05. I read that as the whole premium: at 37.6 times you are not paying for what Danaher earned, you are paying for the recovery in the estimate.
Other measures look kinder. Price to sales is 5.9, against a five-year average of 6.5 and an industry figure of 5.0. Price to book is 2.8, the low end of a range whose average is 3.6. Those point to a stock that is cheap against its own past on assets and sales, and rich only on earnings. That is what a margin problem looks like in a valuation table.
What the price implies
| Earnings basis (EPS) | 29.2x | 36.3x | 43.4x |
|---|---|---|---|
| Fiscal 2025 ($5.05) | $147 | $183 | $219 |
| Trailing 12 months ($5.63) | $164 | $204 | $244 |
| Forward estimate ($6.58) | $192 | $239 | $286 |
Take the middle cell, trailing EPS at the five-year average multiple: about $204, or 4% below the current price. To get to the 52-week high of $241.78 you need either the forward estimate at roughly the average multiple, or trailing earnings at the top of the historical range. The top row, fiscal 2025 EPS at the low end of the range, is $147, and the far corner is $286. The gap between them is about $138 a share on the same company, which is the range of outcomes I am asking you to hold.
What I am leaving out
Two things I cannot judge from this data set. First, the split of Danaher’s margin decline between price, mix and cost, which the company discloses and I do not carry. Second, the acquisition history: Danaher has built itself through deals for decades, and Morningstar’s note on the quote page says as much, but I have no deal-level numbers to test whether a large purchase is behind the second-quarter profit. If you hold the stock, read the segment margin disclosure in the filing before relying on anything above about the cause.
What I can do is compare the pieces I have. Trailing twelve-month revenue is $25.1 billion and trailing net income about $4.0 billion, a net margin near 16%. Fiscal 2022 earned $7.21 billion on $26.6 billion, or 27%. Getting from 16% back toward the low-to-mid 20s is the entire job of the forward estimate, and it is a bigger job than the 6% revenue growth suggests.
The analysts and the score disagree
Of the 18 analysts on the analyst page, 89% rate Danaher a buy and 11% a hold; none say sell. The average target of $222 is 5% above the price, with a range of $195 to $250, or 8% below to 18% above. A group that bullish with a target that close is telling you they like the business but do not see much room in the price.
Our own quant score disagrees, and it moved fast. On September 15 it stood at B with a score of 73. The next day it was C at 39, and it has stayed near 40 since. I do not know which input changed that abruptly, and I would not trade on a one-day score shift. But when a rating moves 34 points in a session, it usually means a threshold was crossed in the underlying data, and it is worth checking the score components on the site before you buy.
| Metric | Value | Context |
|---|---|---|
| Price (approx.) | $211.81 | 52-week range $161 to $242 |
| P/E (TTM) | 37.6x | Five-year average 36.3x |
| Price-to-sales | 5.9x | Five-year average 6.5x |
| Analyst ratings | 89% buy, 11% hold | 18 analysts; average target $222 |
| Dividend yield | 0.68% |
Short interest, at 1.4% of float on August 31, says nobody is betting heavily against it. The four most recent reports moved the shares -11.0%, -0.5%, -4.8% and +5.9%. Three of the four were declines. A stock that falls on three of four reports and holds a 37-times multiple has been carrying more expectation than the reports delivered.
The case against my caution
There is a fair argument on the other side. Danaher closed August at $213.56, up from $194.98 at the end of July, so the market took the post-report drop and bought back most of it within weeks. Morningstar, in the analysis we carry on the quote page, describes a wide moat built on intangible assets and switching costs, and that is the kind of position that can recover margin when volume returns. Revenue growth of 6% in the last quarter is real.
If you believe that, then $6.58 of forward EPS is a reasonable estimate and 32 times is a fair price for a company with these characteristics. I am not confident enough to call that wrong. I am not confident enough to call it right, either, because two quarters of margin data is a thin record.
A note on how to hold this. A stock with a 37-times multiple and a falling record does not need to collapse to disappoint. It only needs to go sideways for a year while earnings catch up to the price, and that is a poor use of capital when a 5% average upside is all the analysts offer. Anyone who wants exposure to the recovery can wait for evidence and pay a little more, which is a cheaper mistake than paying now for a margin that has not appeared.
The number that would make 32 times fair
The next test is the net margin. If the September-quarter margin returns to 17% or better on revenue near $6.3 billion, quarterly net income would land around $1.07 billion. Four quarters at that pace would bring earnings per share toward the $6.58 the forward multiple implies, and 32 times would then look like a fair price for the recovery.
If the margin holds near 14%, the same revenue produces about $0.88 billion, and the trailing multiple stays above 35 for longer. That is the case where the 5% gap to the average analyst target of $222 looks generous, and where the low target of $195, 8% below today’s price, becomes the more useful number. I would not want to add to a position between here and that report.
Financial disclaimer: The content on StockVane is for educational and informational purposes only and should not be construed as professional financial advice. Stock market investing involves risk of loss.
Sources: Dividends (SEC Investor.gov glossary) (https://www.investor.gov/introduction-investing/investing-basics/glossary/dividend) · Dividends tax topic (IRS) (https://www.irs.gov/taxtopics/tc404)