
In 2023 Enbridge’s revenue fell 18 percent, from CA$53.3 billion to CA$43.6 billion. Operating income rose 11 percent that same year, from CA$8.18 billion to CA$9.07 billion. The top line and the profit line were pointed in opposite directions, and that is the most useful thing to know about this company before looking at the dividend.
Enbridge is a pipeline operator, and by the company’s own commonly cited estimate it carries roughly a quarter of the crude oil produced in North America. Its revenue swings with the price of the commodities it passes through and with acquisitions, while its operating income follows contracted volumes and regulated tolls. Since 2022, operating income has risen four years in a row, to CA$11.53 billion in 2025, up 45 percent from the CA$7.96 billion of 2020.
Our read: at $49 a share the stock is a fair price for a dependable payer, not a bargain, and the 5.53% yield is real but the multiple already reflects most of the good news. The case for owning it rests on the income. It does not rest on further upside.
A note on currency before any numbers. Enbridge reports in Canadian dollars, so every revenue, profit and margin figure below is in CA$. The share price, the yield and the valuation multiples are the U.S. dollar figures for the NYSE-listed shares. I do not convert between them.
Revenue is noisy, and that is fine
The financials tab shows revenue of CA$47.1 billion in 2021, CA$53.3 billion in 2022, CA$43.6 billion in 2023, CA$53.5 billion in 2024 and CA$65.2 billion in 2025. That last year was up 22% on the one before. Net income ran CA$2.94 billion, CA$6.06 billion, CA$5.63 billion and CA$7.79 billion across 2022 to 2025.
None of those lines moves smoothly. Net income in 2022 was less than half of 2021’s CA$6.31 billion, then doubled in 2023. Swings of that size are what you see when accounting items such as derivative revaluations sit in the result, and I would not treat a single year of net income as the guide to earning power. The operating line is the steadier evidence, and it has not had a down year since 2021.
The margin picture backs that up, with a caveat. The database EBIT margin was 22.7% in 2025, against 26.9 percent in 2023 and 14.6 percent in 2022. (Operating income divided by revenue gives a lower figure, about 18 percent, because the two use different definitions of operating income. I cite the EBIT number throughout.) A margin that goes from 14.6 to 26.9 and back to 22.7 in three years is not a story about efficiency. It is mostly the effect of revenue moving around a fairly fixed profit base.
Gross margin tells a similar tale from another angle: 33.0% in 2025, 36.0% in 2024 and 40.5 percent in 2023. Three points lost in a year in which operating income grew 17 percent.
The latest quarter is a puzzle
Revenue for the quarter reported on 2026-07-31 came to CA$29.3 billion, up 97% from the same quarter a year earlier and up 31% from the quarter before. The four most recent quarters read CA$14.6 billion, CA$17.2 billion, CA$22.4 billion and CA$29.3 billion, a doubling in one year.
I do not have a cause for that in the data. Acquisitions of gas utilities, higher commodity prices passed through to customers, and the timing of contracts could each explain part of it, and I would not choose among them without the company’s segment notes. What I can say is that 86 percent of the quarter’s revenue came from the Liquids Pipelines segment, at CA$25.2 billion, with Gas Distribution and Storage at CA$2.1 billion and Gas Transmission at CA$1.7 billion. Enbridge is still an oil pipeline business first, and the gas businesses are a rounding error on the revenue line, though not necessarily on the profit line.
The stock moved -1.8% the day after the report. Over recent reports the average move has been 2.0%, which is small. The market treats an Enbridge quarter as a check on a known quantity.
What the multiple says
The valuation tab shows a trailing P/E of 26.2. Against a five-year average of 23.9, today’s multiple is 10 percent above its own norm, at the 75th percentile of a five-year range that runs from 16.9 to 30.9. Set beside the industry average of 16.4, that puts Enbridge at 1.6 times the sector multiple.
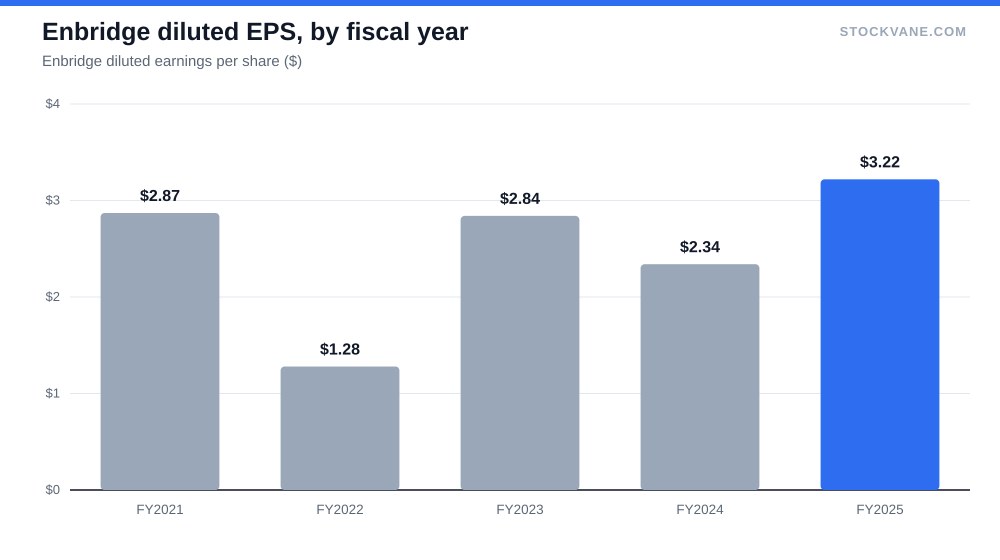
Forward P/E is 21.6, on forward EPS of $2.25, and that is where the growth expectation sits: the gap between trailing and forward implies about 21% EPS growth. I would be cautious about that number. Trailing and forward EPS may not be on the same currency or accounting basis, and the trailing figure has been noisy, as the net income history shows. I treat it as an indication of direction, not as a forecast I would defend to the decimal.
Price-to-book is 2.5 against a five-year average of 2.1, near the top of its range, at the 88th percentile. All three gauges point the same way: the stock is priced above its own history. For a business with an income-oriented shareholder base that is not unusual, since bond yields fall and dividend payers get bid up. It does mean the easy money from a re-rating has been made.
| Metric | Value | Context |
|---|---|---|
| Price (approx.) | $48.73 | 52-week range $41 to $57 |
| P/E (TTM) | 26.2x | Five-year average 23.9x |
| Price-to-sales | 1.8x | Five-year average 2.3x |
| Analyst ratings | 57% buy, 36% hold | 14 analysts; average target $58 |
| Dividend yield | 5.53% |
The dividend is the case
Enbridge paid $2.69 per share over the trailing year, a 5.53% yield at the current price. The company has raised its dividend every year for roughly a quarter century by its own account, a claim I have not tested against this database. It is the number that gets attention.
Whether that payout is safe is a question about cash flow, and the database I use for this piece does not carry distributable cash flow or free cash flow for the company. So I will not offer a payout ratio. The trailing EPS and the dividend may be quoted in different currencies, and a ratio built from them would be false precision. What I would want to see, from the company’s own disclosures, is distributable cash flow covering the dividend with a margin, and net debt to EBITDA within the range management has published.
For a framework on how much of an investor’s return should come from yield and how much from growth, see our piece on high yield versus dividend growth. Enbridge sits in the middle of that argument: a yield above 5 percent and a growth rate that is not zero, but not fast either.
Analysts and positioning
Fourteen analysts on the forecast page cover the stock, and 57% rate it a buy, 36 percent hold and 7 percent sell. The average target is $58, which is 18% above the price. The lowest target, $50, is 3% above it, and the highest, $62, is 28% above. That spread is narrow at the bottom. If the lowest target on the Street is only 3 percent above the price, the market is not far from consensus, and a price near $49 has little cushion between it and the pessimists.
Short interest is 1.7% of float, but with about 8.4 days to cover. That is a long runway for a large-cap stock, so some investors are positioned against it, though not in a way that squeezes. The StockVane quant score dropped from C to D within a few weeks. I read that as weak price momentum: the shares are 14.3% below their 52-week high of $57 and 20% above their low of $41.
What would make this view wrong
Three things. A rate move down would help: lower long-term yields raise the value of a 5.5 percent payer, and the stock could re-rate beyond the 75th percentile it sits at now. Second, if operating income stops growing, the whole thesis weakens, because operating income is what has been steady while revenue and net income were not. Third, the gas businesses have to earn their keep. They are 13 percent of the latest quarter’s revenue and if they underperform, the market will notice.
On the other side, I would be wrong to call it fairly valued if the company can grow EPS by a fifth, as the forward multiple implies. That would put the multiple at 21.6 on a lower base, and the stock would be much cheaper than it looks.
The multiple I would stop paying
I would hold Enbridge for the 5.53% and would not add above roughly 27 times trailing earnings, the middle of the upper half of its five-year range. Below 24, the five-year average, it becomes a straightforward income buy. The number to watch in the next report is operating income: another CA$11.5 billion or better on a trailing basis keeps the argument intact, and a figure below CA$10.5 billion would tell us the steady line has broken.
Financial disclaimer: The content on StockVane is for educational and informational purposes only and should not be construed as professional financial advice. Stock market investing involves risk of loss.
Sources: Dividends (SEC Investor.gov glossary) (https://www.investor.gov/introduction-investing/investing-basics/glossary/dividend) · Dividends tax topic (IRS) (https://www.irs.gov/taxtopics/tc404)