
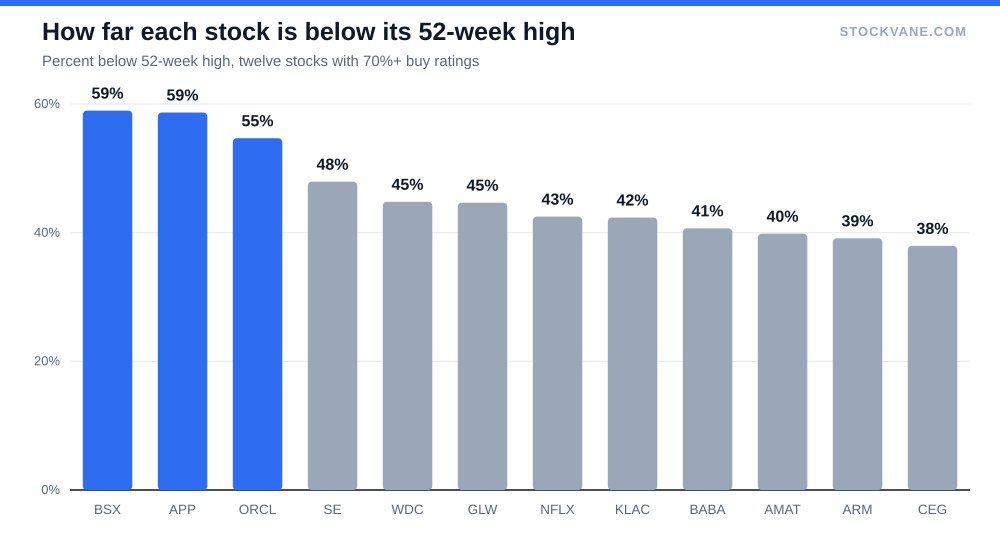
Analysts covering Boston Scientific have a plan for the stock’s recovery, and it is modest. The shares closed at $43.34 on September 18, against a 52-week high of $105.65. The average price target implies a gain of 39%. To get back to the high, the stock would need 144%. So the target recovers about 27% of the ground the stock has lost.
Alibaba’s targets sit at the opposite end. The same calculation gives 96%, which means the analysts expect nearly the whole fall to be undone. Both stocks carry a buy rating from at least 90% of the analysts who cover them.
What we screened for
Analysts are slow to downgrade. We looked for stocks at least 35% below their 52-week high where at least 70% of ten or more analysts rate the stock a buy. Twelve passed. Between them they carry 236 analyst ratings. The median stock on the list is down 44% from its high.
The usual way to read a list like this is to look at target upside. Oracle’s average target is 72% above the price, AppLovin’s 68%, Alibaba’s 66%. The number is easy to read and misleading, because a stock that has fallen 59% needs a gain of 144% to get home, and one that has fallen 38% needs only 61%. A 39% upside means something entirely different for those two cases.
So I added a second measure: the share of the fall that the average target recovers. It is the target minus the price, divided by the high minus the price. It is my calculation, not a figure any analyst publishes, and it has a plain meaning. At 50% a target says the market gets back half of what it lost. Across the twelve names, the median is 56%.
| Stock | Below 52-week high | Buy ratings | Analysts | Average target vs price | Share of fall the target recovers | Quant grade |
|---|---|---|---|---|---|---|
| Arm (ARM) | -39% | 85% | 20 | +14% | 22% | B |
| Boston Scientific (BSX) | -59% | 90% | 21 | +39% | 27% | E |
| Corning (GLW) | -45% | 70% | 10 | +26% | 32% | B |
| Netflix (NFLX) | -43% | 78% | 32 | +35% | 47% | E |
| AppLovin (APP) | -59% | 81% | 21 | +68% | 48% | E |
| KLA (KLAC) | -42% | 74% | 19 | +39% | 53% | B |
| Sea Limited (SE) | -48% | 100% | 11 | +54% | 59% | E |
| Oracle (ORCL) | -55% | 86% | 28 | +72% | 60% | E |
| Constellation Energy (CEG) | -38% | 83% | 18 | +37% | 61% | E |
| Western Digital (WDC) | -45% | 76% | 17 | +57% | 71% | A |
| Applied Materials (AMAT) | -40% | 89% | 27 | +56% | 84% | B |
| Alibaba (BABA) | -41% | 100% | 12 | +66% | 96% | E |
Where analysts and the price agree
At the low end sit Arm at 22%, Boston Scientific at 27% and Corning at 32%. Analysts who cover these stocks have bought the story but have not bought the recovery. Arm is a clear example. Its average target is 14% above the price, and its trailing P/E is about 281, so the multiple on last year’s earnings leaves little room for a large move. A buy rating with a small target gap looks to me like “we like the business, we accept the price”.
Netflix sits in the middle at 47%. Thirty-two analysts cover it, the most of any name here, and their average target is 35% above a price that is 43% under the high. When that many people agree on a moderate number, I trust the number more than I would from eleven analysts.
Where analysts are asking for the most
At the high end sit Alibaba at 96% and Applied Materials at 84%. Alibaba has a 100% buy rating from 12 analysts. Sea Limited has the same 100% from 11. A unanimous list of a dozen analysts is not proof that they are wrong. It does mean there is nobody left on the sell side to convince, and any change in tone has one direction to go.
Oracle is the case I would look at first. It is down 55%, from $325.79 to $147.61, and 28 analysts still put the average target at $254, which recovers 60% of the fall. In our Oracle piece the argument was that a booked backlog and a stock price are answering different questions. That still describes the gap between opinion and price here.
Two worked examples
AppLovin is a good test of why the second measure matters. Its price of $308.06 sits 59% below the high of $745.61, and the average target of $517 looks generous at 68% upside. But recovering the high would take a gain of 142%, so the target undoes only 48% of the fall. Read that way, analysts are leaving room. They expect a rebound and not a full recovery, which is a more defensible stance than the headline suggests.
Boston Scientific shows the same effect from the other side. Its 39% upside looks ordinary. Set against a fall of 59%, it is the second-smallest recovery on the list at 27%. Ninety percent of 21 analysts say buy, and their targets also say the shares would still be well below the old high after the rebound. I read that as unusually restrained for a group that is so positive on the rating.
Why the two can coexist is worth a moment. A buy rating is a relative call, made against the analyst’s other stocks, and a target is an absolute one. An analyst can rate a stock a buy because it looks better than peers at a fair price, while pricing only part of the fall. That is a coherent view, and I suspect it is the most common one on this list.
What the quant rating says about the same names
Seven of the twelve carry an E, the bottom grade, on our quant rating: Boston Scientific, AppLovin, Oracle, Sea, Netflix, Alibaba and Constellation Energy. The other five score well. Western Digital is an A with a score of 98, and Applied Materials a B with a score of 95. Corning, KLA and Arm also hold B grades.
The five with a good grade are hardware and equipment names. I read this cautiously, since the model works from price behavior and valuation and I have not tested it against outcomes on this list. What I can say is that the model and the analysts agree on five of these names and disagree on seven. Where the model says E, the analysts have not followed it.
That divergence is the part of the list I find most useful. If a stock falls 59% and the model has already called it an E, the analysts’ unchanged rating is either a sign that they see something the price does not or that they have not caught up. Sorting the two would take company reports and target-revision dates, and neither is in our data. I am not going to guess which it is name by name.
Why targets lag
Analysts revise targets after prices move, not before. A target set in the spring reflects a spring price. When the stock drops 40% in a quarter, the first thing that changes is usually the price, then the estimates, and the target last. So a wide gap between price and target can mean opportunity, and it can equally mean that the target is stale.
There is a second reason for caution. A high buy percentage is a count of opinions, not a measure of conviction. Twenty-eight analysts on Oracle and ten on Corning are not comparable samples, and with Corning at exactly 70% buy, a single downgrade would take it off this list.
Two of these names connect to themes we have written about. Constellation Energy is part of the power demand story that our piece on the real AI bottleneck explains, and its target recovers 61% of its fall. The chip equipment names, KLA and Applied Materials, belong with the group in our semiconductor stocks piece.
What this list cannot tell you
Three limits are worth stating. First, the average target hides the spread. We have the average, but the low and high targets on each name would show whether the analysts cluster or split, and I have not tabulated them here. Second, the ratings are a snapshot from mid-September. A revision on Monday changes the picture. Third, a screen built on a big fall and a high buy share will always pick up stocks whose fall is continuing. If the market is right about any of them, this list is where it would show up first.
How I would use the list
I would not buy any of these because analysts like them. I would use the list to find the stocks where the price and the opinion disagree, then ask what each disagreement requires.
For names with a small recovered share, such as Arm and Boston Scientific, the question is whether the fall was about the business or about the multiple. For names with a large recovered share, such as Alibaba, the question is whether the target reflects a real change or a target that has not been touched. Read the last two or three earnings reports before deciding, and check when the targets were last revised.
I am also not covering what caused each fall. Our data has news headlines, but I do not attribute a move to a headline without the article, and a list of twelve companies is too many to do that carefully.
The threshold I would watch
The number to track is the share of the fall that targets recover. For names above 80%, such as Alibaba and Applied Materials, I would expect analysts to cut targets before they raise them, and I would treat any cut that pulls the figure below 70% as a sign that the opinion is finally catching up with the price. For names below 30%, such as Arm and Boston Scientific, a rise above 40% would mean analysts are getting more bullish on a stock that has not moved, which is the signal I would look for.
Financial disclaimer: The content on StockVane is for educational and informational purposes only and should not be construed as professional financial advice. Stock market investing involves risk of loss.
Sources: Price-to-earnings ratio (SEC Investor.gov glossary) (https://www.investor.gov/introduction-investing/investing-basics/glossary/price-earnings-pe-ratio) · Earnings reports (SEC Investor.gov glossary) (https://www.investor.gov/introduction-investing/investing-basics/glossary/earnings-report)