
Twenty-seven purchases of $1,000 each, one at the start of every quarter from January 2020, add up to $27,000 put in. On 2026-09-18 that money is worth $61,350. The gain is 127%, and it took no forecasting at all, only the willingness to keep sending the check.
That is the honest answer to what steady buying of Apple has returned, and it is a lot smaller than the number most people carry in their heads. The Apple quote page has the current price; the stock itself rose from $72.27 on January 2, 2020 to $336, a gain of 365% for someone who bought everything on day one. The steady buyer earned about a third of that in percentage terms. I want to explain why the gap is not a failure of the method, and where it starts to matter for a retirement plan.
A note on the window before anything else. The price history in our database begins on January 2, 2020, so everything measured here covers roughly six and three-quarter years, not the eight in the headline. An investor who began in 2018 would have bought at lower prices still, and would show a bigger number, but I cannot verify those prices from our data, so I have not printed them. What follows is what the data supports.
What quarterly buying actually did
The rule was simple. On the first trading day of each January, April, July and October, buy $1,000 of Apple at that day’s close. Nothing else: no extra money in dips, no skipped quarters. Twenty-seven purchases through July 2026 bought a position with an average cost of $147.93 a share, against $336 now.
That average cost is the number to hold on to. It sits at roughly 44% of today’s price, so the position is worth about 2.3 times what each share cost on average. The lump-sum buyer’s cost was $72.27, or 22% of today’s price. Both did well. The lump-sum buyer did better only because Apple went up for most of the period, and a lump sum always wins in a stock that rises: every dollar was in the market longest.
Why bother with the slower method, then? Because nobody knows in January 2020 that the next six years will be a rising market, and most retirement savers do not have a lump sum in the first place. They have a paycheck. The comparison that fits a real saver is quarterly buying against not buying, or against buying at moments chosen by feeling, and there the boring rule holds up well.
The stretch where it hurt
Apple started 2022 at its high and the year was the test. From a closing high of $177.79 on 2022-01-03 the stock slid to $123.83 on 2022-12-28, a fall of 30%. By the end of that December the twelve quarterly purchases made so far were up only 15% on the cash put in, after nearly three years of contributions. That is a hard number to look at. Three years of discipline, and the account had earned about what a decent savings product would have paid.
Then came 2025. From $245.59 on 2025-02-24 the stock dropped to $171.37 on 2025-04-08, another 30% fall in about six weeks. Measured from the highest close reached before it, the worst peak-to-trough decline in our data is 33%. The whole gain since 2020 sat on the other side of two drawdowns of about a third, and most of us do not remember how much of that we would have held through.
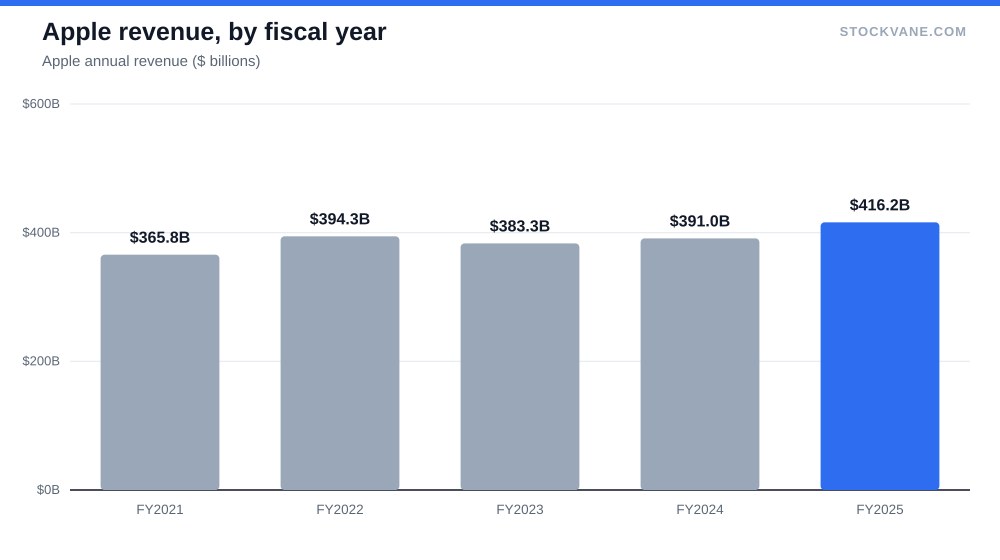
The two episodes are worth setting side by side. The first fall took a year to play out and the second took six weeks. Both times the business kept earning money. Fiscal 2025 revenue was $416.2 billion, up 6% on the year before, and net income reached $112.0 billion against $93.7 billion. What fell was the price the market paid for each dollar of that profit.
Where the return came from
The stock rose 4.7 times since January 2020. Diluted earnings per share rose from $3.28 in fiscal 2020 to $7.46 in fiscal 2025, a factor of 2.3. That leaves the rest to the multiple. On fiscal 2020 earnings, the January 2020 price was 22 times earnings. The trailing P/E today is 38.5, against a five-year average of 31.1, and our valuation tab puts the current multiple at the 94th percentile of its own five-year range.
I read this as the most important caveat in the whole exercise. In proportional terms about half of the price gain came from profits, and the other half came from investors agreeing to pay more per dollar of profit. Earnings growth can repeat. A rising multiple cannot repeat indefinitely from a level already above the range of the last five years. Anyone who starts today buys at 38.5 times earnings, and the quarterly method does not change that starting point, it only spreads it out over a few years. I made a longer version of that argument in my note on why widespread optimism about Apple makes me cautious, and I still hold both views: the past six years were excellent, and the next six start from a much higher price.
What the business looks like now
The latest financial statements show a quarter that brought in $109.4 billion in revenue, 16% more than a year earlier, and -2% against the quarter before it. Our segment data for that quarter shows the iPhone at about half of sales, Services at about 28%, and the Mac, iPad and wearables lines making up the rest. Gross margin for fiscal 2025 was 46.9%, up from 46.2% the year before, which is the mix shift toward Services showing up in the income statement.
That is the structural argument for owning it as a long-term holding. Services is recurring, carries higher margins than hardware, and does not depend on a new phone selling well in a given autumn. Operating income of $133.1 billion on that revenue works out to a 32% operating margin. Few companies at this scale earn a third of each sales dollar as operating profit, and even fewer have done it for the whole six years.
| Metric | Value | Context |
|---|---|---|
| Price (approx.) | $336.13 | 52-week range $243 to $344 |
| P/E (TTM) | 38.5x | Five-year average 31.1x |
| Price-to-sales | 10.5x | Five-year average 7.8x |
| Analyst ratings | 60% buy, 24% hold | 25 analysts; average target $348 |
| Dividend yield | 0.31% |
The company also has weak spots I do not want to skip. On July 30, 2026 the stock moved -7.4% on the day after earnings, against an average earnings-day move of 2.9%. That reaction was more than twice the norm, and it came after a quarter of 16% revenue growth. When strong growth is punished, it usually means the price already expected more. Twenty-five analysts cover the stock; 60% rate it a buy, and the average target of $348 sits only 3% above the current price. There is not much cushion between the price and what the professionals think it is worth.
The retirement arithmetic, and its limits
Take the $61,350 position at face value. With a dividend yield of 0.31% it pays roughly $190 a year, which will not fund anything. Apple is a growth holding, not an income one, and a retirement plan built on it has to sell shares to raise cash. That is a different risk from the one a dividend stock carries. You are exposed to the price on the day you need the money.
Here is where the two drawdowns matter. A retiree who needed to withdraw during the 33% decline in 2025 would have sold shares at a price a third lower than a few weeks earlier. The investor in the accumulation phase, still buying, is helped by a fall: the same $1,000 buys more shares. The same event has opposite effects on a saver and a retiree. That is the core reason a single stock should not be the main plan, however good the business is.
The sensible use of a position like this is as one sleeve of a larger portfolio. Broad index funds and bonds carry the boring, stabilising work, and the Apple holding is the part you have underwritten yourself and can afford to see fall by a third. If you have not read the company’s annual report and have no view on Services, this is a different exercise, and I would start with the framework in how I actually pick stocks before buying any single name.
What I would not do
I would not sell covered calls against a core holding you want to keep. The trade caps the upside in exchange for a small premium, and in a stock that gained 4.7 times in six years, getting called away is the outcome that costs the most. I would not borrow to buy more during a decline, either. Both the 2022 and 2025 falls were survivable because the money was paid in from income. Borrowed money turns a 30% decline into a forced sale.
I would also not treat the 127% figure as a forecast. It is a measurement of one path: a rising stock with two sharp interruptions, bought on a fixed schedule. Change the start date by two years and the number changes. Start in early 2022 and the first two years show nothing at all. Prices in this piece are closes from our database as stored, they do not include dividends, and the fees or taxes an actual investor would pay are not counted. Terms of any brokerage account differ, and this is an illustration of a method, not personal advice.
The drawdown I would test the plan against
Ask a plainer question than the return: what would you do with the position at $243? That is the 52-week low, and the stock now trades 38% above it. If a fall to that level would make you stop buying, or sell, then the quarterly rule was never yours, and no historical percentage will fix that. The number I would look at next is the trailing P/E: a reading back near the five-year average of 31.1 would mean the price had caught down to the earnings, and that is the point at which I would be comfortable adding again.
Financial disclaimer: The content on StockVane is for educational and informational purposes only and should not be construed as professional financial advice. Stock market investing involves risk of loss.