
One share of Goldman Sachs costs about $942. One share of Apple costs about $336. In the Dow Jones Industrial Average, that means a dollar move in Goldman counts for the same as a dollar move in Apple, and Goldman’s price is 2.8 times Apple’s, so a percentage move in Goldman pushes the index nearly three times as hard. Apple is worth about 17.9 times as much as Goldman.
That mismatch is the whole story of DIA, the SPDR fund that tracks the Dow. It is a sensible fund if you know what it is. Most people who buy it think it is a smaller S&P 500. It is closer to a portfolio ordered by share price, which is a much stranger thing to own.
How the arithmetic works
A price-weighted index adds up the share prices of its members and divides by a number the index provider adjusts over time. That is the whole method. Nothing in it asks how many shares exist or what the company is worth. A stock at $942 gets nearly twenty times the pull of a stock at $48, whether the company behind it is enormous or modest.
To see it with real figures, I took the 29 Dow names I could match in our September 18 snapshot (Nike was missing from it) and compared each one’s share of the total of their prices with its share of their combined market value. The results are lopsided.
| Company | Share price | Market value, $ billions | Share of price total | Share of market value |
|---|---|---|---|---|
| Goldman Sachs | $942.00 | 274 | 11.3% | 1.1% |
| Caterpillar | $808.99 | 372 | 9.7% | 1.5% |
| Microsoft | $493.78 | 3,667 | 5.9% | 14.8% |
| Apple | $336.13 | 4,906 | 4.0% | 19.7% |
| Nvidia | $222.27 | 5,357 | 2.7% | 21.6% |
| Verizon | $48.09 | 200 | 0.6% | 0.8% |
Goldman is 11.3% of the price total and 1.1% of the market value. Nvidia is the reverse: 2.7% of the price total and 21.6% of the market value. Compare Nvidia with Caterpillar. A share of Caterpillar at $809 carries 3.6 times the price weight of a share of Nvidia at $222. Nvidia is 14.4 times bigger by market value.
The top five names
Rank the 29 by share price and the top five are Goldman Sachs, Caterpillar, Microsoft, Amgen and UnitedHealth. Together they make up 36% of the price total. By market value the same five are only about 20%. The bottom five by price are Verizon, Coca-Cola, Disney, Walmart and Cisco. They add up to 5.4% of the price total and 8.2% of the market value.
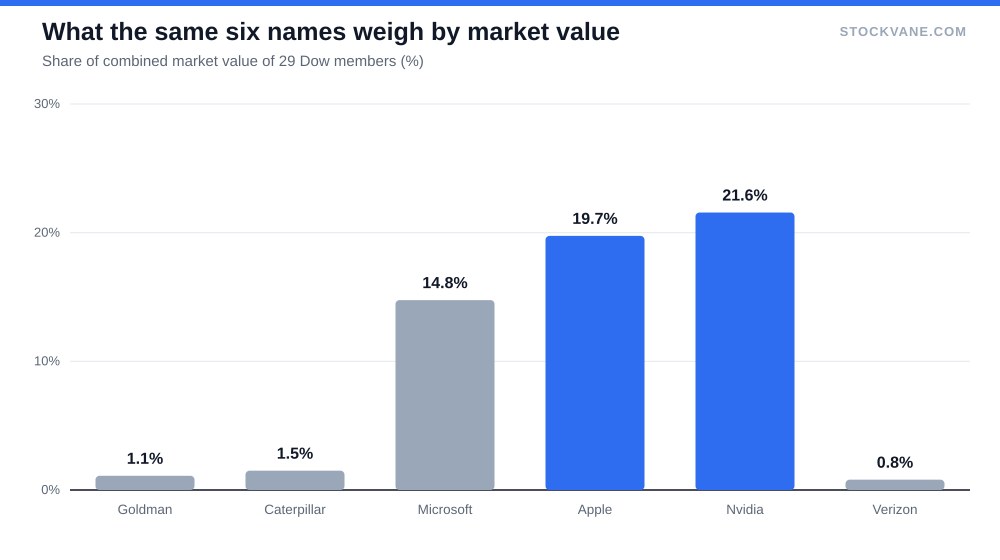
Read that as a statement about what you are buying. A portfolio that puts a third of its weight in five stocks because their share prices are high is not a portfolio built around companies’ importance to the economy. Its weights come from a historical accident. If Goldman split its stock two for one tomorrow, its weight in the index would roughly halve with no change in what the bank is worth.
That is why the Dow has always had an odd relationship with stock splits. The index provider adjusts the divisor so the level does not jump, but the weights move. Companies that split get less influence. Companies that never split get more. Microsoft, at $494, shows the other side. Our Microsoft forecast is about Azure and AI spending, but its pull on the Dow also depends on a share price near $500, and that price is not a measure of how big the company is.
What that does to returns
Not owning what moves the S&P 500 is the price of the Dow’s construction. Nvidia is about a fifth of the market value of these names and under 3% of the price total. Apple is close to a fifth of the value and 4% of the price. A fund that mirrors the Dow rides those companies far less than a fund weighted by market value does.
Our data shows what that has meant lately. DIA closed at $515.88, which is 5.4% below its 52-week high of $545.04 and 15.3% above its low of $447.25. SPY is 2.0% below its high and 21.7% above its low. So over the past year the S&P 500 fund has gained 6.3 percentage points more off its low, and it is 3.3 points closer to its peak.
I read that gap as the weighting at work. It is an inference. I have no fund holdings in the database and no way to confirm it, and DIA also owns a different mix of industries, with more banks and industrials and fewer chip and platform companies. The part I am confident about is the direction: in a year when the largest technology companies did the pulling, a fund that gives them little weight was always going to lag.
The low-priced end of the list
Turn the table over and look at the cheap shares. Verizon trades at about $48. Its market value is about $200 billion, and Goldman is worth only 1.4 times that, yet Verizon accounts for 0.6% of the price total. Coca-Cola at $88 and Walmart at $107 sit in the same corner. Walmart is worth about $847 billion, roughly three times Goldman’s value, and it carries about 1.3% of the price weight.
None of that says these are bad stocks. It says the index has no opinion about them. A company can double in value and, if its share price stays modest, still count for little. The reverse also holds, and it is the more uncomfortable direction for anyone who thinks an index should reward size. The stocks with the highest share prices have not necessarily earned their place by being the biggest or the best, and the ones with the lowest prices have not necessarily earned their smaller slice.
Why the design has lasted
The Dow dates from 1896, a time when adding up thirty prices and dividing by thirty was as much arithmetic as a clerk could manage. The method survived because it is easy to publish, easy to check and easy to say on the evening news. I think it also survived because the index has been a fairly good stand-in for the mood of large American companies, and nobody has needed it to be more than that.
Investors did need more once funds arrived. A fund that has to hold the index has to hold it as built. So DIA carries the quirks without choice. Read it as a copy of an old measuring stick. No manager picked these thirty as the best stocks.
What a market-cap fund would do differently
Suppose you replaced the Dow’s weights with market-value weights for the same 29 names. Nvidia would jump from 2.7% to 21.6%, Apple from 4.0% to 19.7% and Microsoft from 5.9% to 14.8%. Goldman would fall from 11.3% to 1.1%, and Caterpillar from 9.7% to 1.5%. The result would look like a very different fund, dominated by three technology companies and far more exposed to whatever the chip and platform cycle does next.
I raise that because the price-weighting is sometimes defended as protection against concentration, and there is something to it. No single company can dominate the Dow the way a few trillion-dollar names can dominate the S&P 500. But the protection is accidental. It comes from the arithmetic of share prices, and it could reverse if a large company split its shares or a small one let its price climb.
Thirty companies, chosen by a committee
The Dow’s second odd feature is its size. It holds 30 companies, picked and replaced by a committee at the index provider, not by a mechanical rule tied to market value. That makes it a narrow slice, and it makes membership less predictable. A company can be added because the committee wants a sector represented, and dropped because it no longer fits.
Some of this is a strength. Because the committee cares about established firms, the index tilts toward companies that have been through a few cycles. JPMorgan, which trades near $350 a share, is a typical member: large, profitable and a fixture. Some of it is a weakness, since a subjective process gives you no rule to point at when the list changes.
Who should own DIA
A holder of DIA gets 30 large companies, a tilt toward high-priced shares, and lower technology exposure than the S&P 500. If you already own a broad fund, DIA adds a value-and-industrials flavor and some overlap. If you own nothing else, it is a narrow core.
There is a fair case for the fund, and I do not want to wave it away. A lower-technology mix could help in a year when the biggest platform stocks stumble. The gap that hurt DIA lately would then work in its favor. My concern is that this is a bet on the weighting, and most buyers do not realize that they are making it.
Dividends and fees are the practical side. I do not have DIA’s expense ratio or its yield in our data, so I will not quote them. Check both on the fund provider’s page before comparing it with a cap-weighted alternative, and see how I track fund demand in our guide to money flows.
The 3.3-point gap to watch
DIA needs to rise about 5.7% to reach its 52-week high of $545.04. SPY needs about 2%. The number I would follow is that gap, now 3.3 points. If it narrows because DIA rises while SPY holds, the price-weighted names are catching up and the weighting is not the problem. If it widens past 5 points, the S&P 500 is doing the leading, and DIA is a reasonable diversifier and a poor substitute.
I would use DIA for what it is: a satellite holding with a distinct weighting, sized so that a lagging year changes nothing about my core position.
Financial disclaimer: The content on StockVane is for educational and informational purposes only and should not be construed as professional financial advice. Stock market investing involves risk of loss.
Sources: Dividends (SEC Investor.gov glossary) (https://www.investor.gov/introduction-investing/investing-basics/glossary/dividend) · Dividends tax topic (IRS) (https://www.irs.gov/taxtopics/tc404)