
The most useful thing I know about wars and stock prices is how little the day-to-day headline count tells you. Missile strikes, ceasefire announcements and threats move the screen for an afternoon. What decides whether your portfolio is worth less in three months is a much duller question: does the shock reach the economy through oil, inflation and interest rates?
That is the question for August. As I write this in late July, the U.S.-Israel war with Iran is five months old and a ceasefire has come and gone. Brent crude has just touched $100 again. My view is that stocks can absorb a lot of bad news of the noisy kind and much less of the kind that shows up in a price index. I will lay out the history, what this war has already done to the market, and why I think the oil channel is the part to watch.
The timeline in five dates
On February 28, joint U.S. and Israeli strikes hit Iranian leadership and military targets, including the killing of Supreme Leader Ali Khamenei. Brent closed the day before at $70.94. Within days the Strait of Hormuz, through which more than a fifth of the world’s oil trade normally passes, was effectively shut, and Brent went past $120 in early March. The International Energy Agency has called it the largest supply disruption in the history of the oil market.
On June 15 the U.S. and Iran confirmed a framework to end the war, and stocks rallied while oil fell, a relief move that showed how eager the market was to price an ending. On July 8, President Trump told a NATO summit that the ceasefire was “over.” Brent settled up 5.4% that day at $78.19, and the Dow fell sharply. By July 23 Brent was back at $100.69, and the next day it closed at $96.78. The IMF, in a July 9 update, cut its 2026 world growth forecast to 3%, and said growth would fall to 2.5% if oil averaged around $100.
That is at least three swings between hope and escalation in five months, more than most episodes in the history below ever produced.
What the average shock looks like
Wall Street firms have counted this before. LPL Research’s study of geopolitical shocks since World War II puts the average S&P 500 decline at roughly 5%, with the index bottoming in about three weeks and recovering in one to two months. Hartford Funds found the index higher a year after the start of an armed conflict roughly 70% of the time. Those are averages across very different events, so they describe a tendency and promise nothing.
| Event | Maximum S&P 500 drawdown | Days to the low | Time to recover |
|---|---|---|---|
| Cuban Missile Crisis (1962) | About 7% | n/a | About two weeks |
| Iraq invades Kuwait (1990) | 17.5% | 71 days | About six months |
| September 11 attacks (2001) | 11.9% | 11 days | About 30 days |
The three events in the table show the range. In 1962 the Cuban Missile Crisis cost about 7% and was recovered in around two weeks. September 11 produced a maximum drawdown of nearly 12% and a recovery in about a month. Iraq’s invasion of Kuwait in 1990 was the painful one: a 17.5% drawdown, 71 days to the low and about six months to get back. What separated the last from the first two was oil, which roughly doubled in a few months while the economy was already sliding into recession. The size of the headline had little to do with it.
For a broader look at what today’s index is asking investors to pay before any of this, our piece on whether the S&P 500 is overvalued covers the starting point, and it is not a cheap one.
What this war has done to stocks so far
We can measure the first five months from our own data. Across the 300 large U.S. stocks StockVane tracks, the median stock fell 5.1% in March, the first full month of the war. It then gained 4.9% in April, slipped 0.7% in May and added 2.6% in June. Month-end to month-end, that is a bad month followed by a recovery, not a slide.
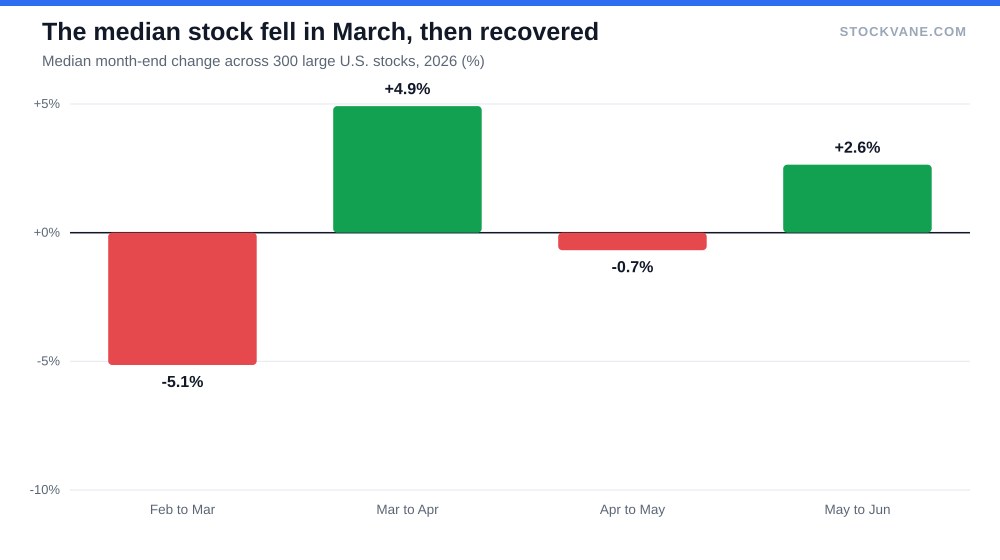
The pattern looks like the historical playbook: a sharp first reaction, then a slow return. That is no proof the playbook holds. The figures end on June 30, before the ceasefire collapsed, so July is missing, and the recovery should not be read as a promise.
The sectors that were supposed to be the winners give a useful reality check. Energy stocks jumped in March and then gave all of it back and more.
Exxon rose about 11% in March and Occidental about 23%. By the end of June, Exxon was about 19% below its March close and Occidental about 25% below. The Exxon quote page and the Chevron page show where the shares trade now. Note that the June 15 framework deal falls inside that window, so I would not read the decline as the market ignoring oil. Investors who bought the March spike had to sit through a long fade.
Defense stocks did not trade as a simple war hedge either. Northrop Grumman fell about 25% from its March close to its June close, and Lockheed Martin about 15%. RTX, with more commercial aerospace business, was nearly flat over the same stretch.
| Company | Feb close | Mar close | Jun close | Feb to Mar | Mar to Jun |
|---|---|---|---|---|---|
| Exxon Mobil (XOM) | $150 | $167 | $136 | +11% | -19% |
| Chevron (CVX) | $183 | $203 | $164 | +11% | -19% |
| Occidental (OXY) | $52 | $64 | $48 | +23% | -25% |
| ConocoPhillips (COP) | $112 | $130 | $103 | +16% | -21% |
| Lockheed Martin (LMT) | $646 | $597 | $506 | -8% | -15% |
| Northrop Grumman (NOC) | $718 | $676 | $507 | -6% | -25% |
| RTX (RTX) | $201 | $191 | $189 | -5% | -1% |
The table puts the spread in one place. Every energy name is up sharply from February to March and down by a fifth or more from March to June. Every defense name fell in both windows, although RTX barely moved in the second. Two months of data cannot settle whether either group is a reliable hedge, and I would treat five months of one war as a small sample. What it does show is that owning the obvious winners after the news broke was not a comfortable trade.
Why this shock is not a copy of the old ones
Most historical shocks were events. This one is a supply disruption to the most important commodity in the world, and it has lasted five months. The IMF’s own scenarios show the sensitivity: if oil averages about $82 a barrel, global growth is 3.0%; at $100, 2.5%; and if disruptions run into next year, around 2%. It also expects global inflation to reach 4.7% this year, up from 4.1% in 2025.
Inflation is the wrinkle for stocks. A central bank that would normally cut into a shock may be stuck when energy prices push the index higher. That is the route by which a war reaches a portfolio. I covered how the Fed’s bind works in our piece on why the Fed is stuck, and it still describes the trade-off.
I should be clear about what I do not know. Reports since March have described Hormuz traffic as sharply reduced, but I could not tell you how much oil is moving through the strait this week, and that number matters more than any headline about strikes. If it is close to normal, the July jump in Brent is mostly fear. If it is still restricted, then the market has been calmer than the supply picture justifies.
What I would and would not do
I would not sell a diversified stock portfolio because of a war headline. History argues against it, and the March-to-June data from this conflict shows the median stock recovering within a quarter. Sitting entirely in cash is not a strategy either, because the recoveries in the table came quickly. I would not chase energy either. The March spike was the wrong place to buy, and the same could apply to another jump in Brent.
There is also a case for patience with cash. If you were planning to buy anyway, the first weeks of a shock have historically offered better prices than the weeks after it. Splitting the purchase over a couple of months removes the need to guess the bottom. I would check position sizes, because even a good-case recovery takes weeks, and a portfolio that cannot sit through a bad six weeks is the real risk. And I would look at how much of the portfolio is exposed to companies that depend on cheap fuel, such as airlines, chemicals and freight, since they are the cleanest way this shock reaches earnings. The weekly recap on the semiconductor sell-off and Iran tensions shows how quickly the market has moved from one worry to another.
The variable I would watch instead
Watch the price of oil and the state of the economy, not the strike count. If Brent stays above $100 for months and unemployment starts to rise, the average from history stops applying, and August could be worse than the past suggests. If oil settles back toward $80 and jobs hold up, this becomes another entry in the long list of shocks the market absorbed. Sentiment has already swung between those outcomes several times this year, and one weak jobs report or one closed shipping lane could flip the odds again, which is why I would keep position sizes modest. I lean toward the second outcome, with less confidence than I had in the spring, and I would rather admit that than pretend the data settles it.
Financial disclaimer: The content on StockVane is for educational and informational purposes only and should not be construed as professional financial advice. Stock market investing involves risk of loss.
Sources: Federal Reserve monetary policy (https://www.federalreserve.gov/monetarypolicy.htm) · Earnings reports (SEC Investor.gov glossary) (https://www.investor.gov/introduction-investing/investing-basics/glossary/earnings-report)