
Three times the index is the promise. Three times the daily move is the contract, and those two sentences describe very different investments. The easy mistake is to read the first and sign the second.
TQQQ, the ProShares UltraPro QQQ fund, is a good product that does exactly what it says. My problem is with how it gets used. Over one year it has climbed about 92% from its 52-week low while QQQ, the fund it magnifies, has climbed about 30%, and yet TQQQ sits about 19% below its high while QQQ is only about 3.5% below its own. I think that gap explains everything about how to rate it: a strong tool for a short window, and a poor one for a long hold.
What the fund promises
TQQQ aims to deliver three times the daily performance of the Nasdaq-100, before fees. The important word is daily. The fund resets its exposure every trading day, so its return over a week, a month or a year is not three times the index’s return over that stretch. It is the result of compounding a long series of separate daily bets.
As of September 18, 2026, public fund listings show TQQQ near $71.53, with net assets around $32.8 billion and an expense ratio of 0.82%. It has traded since February 2010, which means there is a long live record through strong rallies, a pandemic crash and one bruising bear market. Volume runs in the tens of millions of shares a day, so getting in and out at retail size is not a problem. On August 4 the fund jumped more than 10% in a single session, according to 24/7 Wall St., and that is the kind of day the product is built to produce.
The Nasdaq-100 is dominated by a few very large companies, including Nvidia and Microsoft, so a position in TQQQ is a 3x bet on how a small group of stocks behaves from one day to the next.
One year of range
The 52-week range tells you what you are signing up for. TQQQ has traded between $37.32 and $88.09, so the high sits about 136% above the low. QQQ’s range over the same year is about 34.7%, from $555 to $748.
Divide one by the other and you get about four. The fund’s range is roughly four times wider than the index’s, a little more than the 3x you might expect (three times 34.7% is about 104%), because compounding in a rising trend adds to a 3x fund’s gains just as it adds to its losses in a falling one. Measured off the low, TQQQ is up about 92% and QQQ about 30%, a ratio near 3.1, which is what the promise says. Measured off the high, the ratio is far larger: TQQQ is 18.8% below its peak and QQQ is 3.5% below. The two peaks need not have happened on the same day, so I would not read too much into the gap. It still shows how far a 3x fund can sit from its high while the index looks fine.
How volatility decay works
Because the fund rebuilds its 3x exposure every day, a losing day shrinks the base and the next day’s percentage applies to the smaller amount. Say the index falls 10% on Monday and rises 11.11% on Tuesday. It ends the two days exactly where it started. TQQQ falls about 30% and then rises about 33.3%, and it ends down 6.7%.
| Scenario | Nasdaq-100 (1x) | 3x daily fund |
|---|---|---|
| Start | 100.0 | 100.0 |
| Day 1: index falls 10% | 90.0 | 70.0 |
| Day 2: index rises 11.11% | 100.0 | 93.3 |
| Net result | Flat | -6.7% |
| Ten days alternating -3% and +3% | 99.6 | 96.0 |
The effect grows in choppy markets. If the index alternates between a 3% loss and a 3% gain for ten days, it ends about 0.4% lower, which is nothing. A 3x fund making the same moves at 9% each way ends about 4.0% lower. Nothing about the fund failed. It compounded exactly as designed, and the design costs money when direction keeps changing.
Steady trends work the other way. If the index gained 20% in twenty equal daily steps, the 3x fund would gain about 72%, more than the 60% you would expect from tripling. If the index lost 20% in twenty equal steps, the fund would lose about 49%, less than 60%. That asymmetry is why the fund looks brilliant in a smooth rally and why holders forget the choppy stretches. The arithmetic does not change with the headlines. What changes is which path shows up.
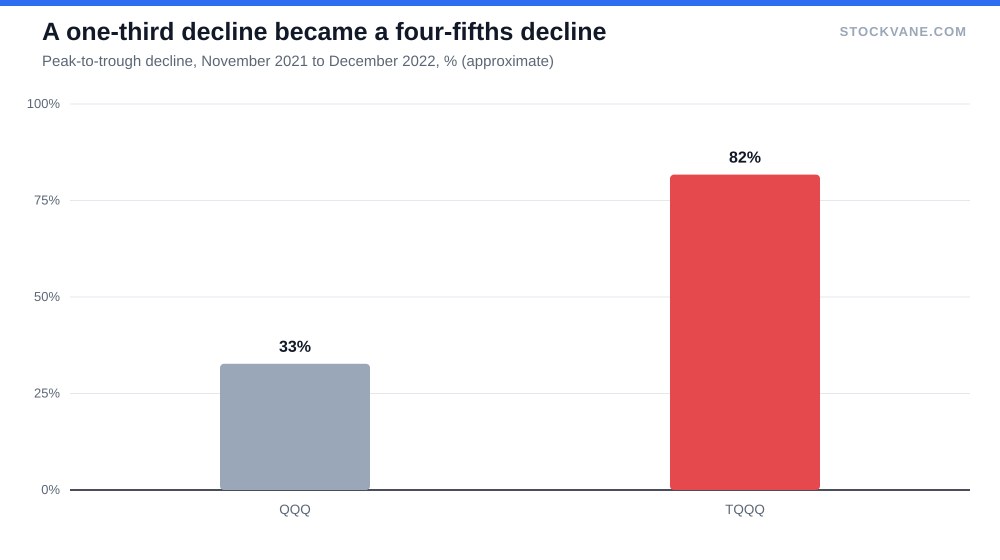
Over a longer stretch the same mechanics look worse. Widely cited fund histories put TQQQ’s peak-to-trough decline between November 2021 and December 2022 at about 82%, against about 33% for QQQ, and recovering from an 82% loss takes a gain of roughly 376%. Those two figures come from public fund summaries, outside our database, so treat them as approximate. The shape is what matters: a decline of a third in the index became a decline of four-fifths in the fund. Whether a drop like that could happen again depends partly on what the market is charging for the index today, which our S&P 500 valuation analysis covers for the broad market.
The cost of holding it
The expense ratio is 0.82%, compared with about 0.2% for QQQ. On $10,000 that is $82 a year against $20, a gap of about $62 before any decay. Next to the decay in a bad year that gap is small. It also never stops, which matters in a long hold.
The same issuer runs a 2x fund and inverse funds tied to the same index. The daily reset applies to all of them, so everything above carries over, and the inverse version decays too, which surprises people who assume a bearish 3x fund is the safe mirror image. It is not. A short-term hedge can work, and a long-term hedge usually bleeds.
Why this environment is hard on it
The Nasdaq has been pushed around by oil, by the Fed and by questions about how much the AI buildout can earn. The Federal Reserve raised rates on September 16 for the first time since 2023, and I wrote about why that leaves stock investors stuck in a separate piece. The AI question sits underneath the Nasdaq-100 too, and the AI capex analysis looks at whether the spending justifies the concentration.
That backdrop is a choppy one. The index can gain 2% on a good headline and give it back on the next, and each reversal costs a 3x fund more than it costs the index. In a clean uptrend, like parts of 2023 and 2024, the same compounding works in a holder’s favor, because each day’s gain builds on the last. Whether the fund helps or hurts a holder depends on the path the index takes, and nobody knows the path.
The rating, category by category
I rate funds with the same framework we use for stocks, adjusted for what a fund is.
| Category | My read | Why |
|---|---|---|
| Liquidity | Strong | Tens of millions of shares a day; tight bid-ask spread |
| Cost | Middling | 0.82% expense ratio, against about 0.2% for QQQ |
| Tracking the daily target | Strong | Does what it says over a single day |
| Long-term holding | Poor | Daily reset compounds against you when direction keeps changing |
| Short-term tactical use | Good in a clean trend | Works best without sharp reversals; needs an exit plan |
Trading it is easy, since liquidity sits at the top of its category. Holding it costs more. The 0.82% expense ratio is standard for a 3x product but expensive next to an index fund, and it weighs most in the choppy stretches that also cause the worst decay. For a long hold I rate it poor and would not soften that. In a clean trend it does its job well, which is why the fund is so large despite its structure.
If you have decided it fits
Most major brokers allow 3x ETFs, though some ask for a one-time risk acknowledgment before the first order. The size question comes next. A position that is normal for a large-cap stock is usually too big here, given a range that wide, and many disciplined traders cap 3x exposure at a small share of the account. A limit order beats a market order, because a fund this actively traded can fill away from the price on your screen. The exit belongs in writing before the entry, both the profit target and the level where the thesis is wrong. With daily-reset mechanics, deciding later is not a risk plan.
How short is short? I do not have a study that gives a clean answer, and the honest reply is that it depends on how choppy the index is. My own working rule is days to a few weeks, and any hold that runs past a month has to justify itself again in writing. That is a judgment, not a measured threshold.
I would also check the position more often than a normal holding. Hourly checking would be silly. A multi-week hold still deserves a weekly look, especially with oil and rates moving as they are.
What I would write down before buying
My judgment is that TQQQ rates well as a short-term tool and poorly as a long-term holding, and I do not see a middle. The fund does what it says, and 15 years of trading history show it. What it cannot do is turn a modest view about technology into a safe long-term position.
In the current market I would use smaller sizes and shorter holding periods than usual. If you cannot say when you would sell and why, the honest alternative is QQQ, which carries a quarter of the cost and none of the daily reset.
Financial disclaimer: The content on StockVane is for educational and informational purposes only and should not be construed as professional financial advice. Stock market investing involves risk of loss.
Sources: Federal Reserve monetary policy (https://www.federalreserve.gov/monetarypolicy.htm) · Earnings reports (SEC Investor.gov glossary) (https://www.investor.gov/introduction-investing/investing-basics/glossary/earnings-report)
Pingback: How Buying Apple Stock Turned a Retirement Plan Into an 80% Gain – StockVane