
Walmart fell 9.2% on August 20, the worst single day any of these four stocks has had in the past year. The market’s average worst day over the same year was 3.3%. A list built to avoid single-stock damage that includes a stock with a hit that size deserves an explanation, and I owe one before anything else.
This is the list I first wrote on August 28 as five stocks for September, with the argument that a portfolio can be built to lose less on a bad day rather than to win more on a good one. I have rerun it against the StockVane database as of September 18. My view has not changed: four of the five names still fit a win-rate-first brief, though one of them fits it less well than I claimed, and the price you pay for each has drifted further apart than the labels suggest. Church & Dwight, the fifth name, is not in our coverage, so I cannot measure it and I am not going to pretend to.
The filters, and what I can now test
The screen had four rules. First, no earnings report inside September. Second, a business not tied to one product or one customer. Third, low sensitivity to the market. Last, an overhang already resolved, where possible. The first is a calendar fact and the database can check it. Berkshire reported on August 10 and NextEra on July 24. Walmart followed on August 20. Johnson & Johnson’s third-quarter report is listed for October 13. All four cleared the first filter, and none of them had an earnings report between August 28 and September 18.
The market-sensitivity rule is where I have to be careful. Published betas are computed by data vendors with their own windows, and I do not carry them in our data. What I can compute is behavior. I took the daily closes of each stock over the past year and set them against an equal-weighted average of the 37 largest US stocks in our coverage, which I use as a rough market proxy. Daily volatility for that proxy was 1.09%. Berkshire came in at 0.91% and Johnson & Johnson at 1.18%. NextEra measured 1.33%. Walmart measured 1.61%.
| Stock | Close, Sep 18 | Trailing P/E | From 52-week high | Daily volatility | Worst day, past year | Change since Aug 26 |
|---|---|---|---|---|---|---|
| Berkshire Hathaway (BRK.B) | $509.77 | 12.8x | -5% | 0.91% | -4.9% | +1.0% |
| NextEra Energy (NEE) | $80.47 | 18.1x | -17% | 1.33% | -4.6% | -3.7% |
| Johnson & Johnson (JNJ) | $269.99 | 31.3x | -4% | 1.18% | -3.7% | -0.0% |
| Walmart (WMT) | $106.73 | 38.7x | -21% | 1.61% | -9.2% | +2.3% |
| Proxy: 37 largest stocks, equal weight | n/a | n/a | n/a | 1.09% | -3.3% | +1.3% |
Read down the volatility column and only Berkshire moves less than the proxy. Johnson & Johnson is a little above it and NextEra about a fifth above. Walmart is well above it, by about half. On the measure of how much a stock jumps around, the “low beta” label was generous to three of the four.
Berkshire: the anchor that behaved like one
Berkshire closed at $504.91 on August 26 and at $509.77 on September 18, a gain of 1.0%. The proxy rose 1.3% over the same stretch, so it lagged slightly on a rising tape, which is what an anchor does. Trailing earnings are $31.04 a share, which puts the P/E at 12.8. The stock trades at 1.46 times book value, 5% below its 52-week high.
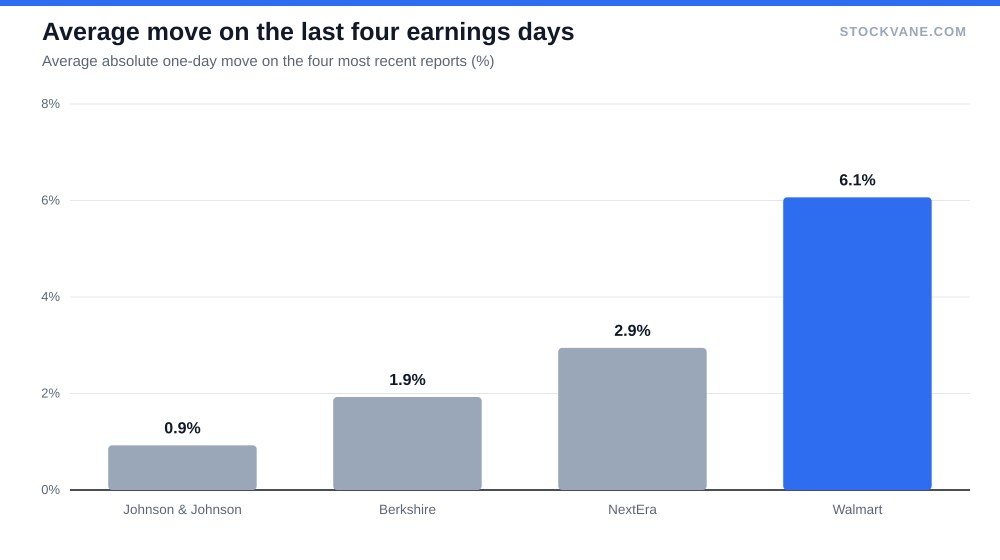
Its worst day in the past year came on March 2 at 4.9%, the day of its fourth-quarter report. That is the whole point. The largest one-day fall in twelve months is smaller than Walmart’s fall on August 20, and its average move on its last four report days was only 1.9%.
I would not pretend it is exciting. Berkshire pays no dividend, so the return is entirely price, and the StockVane quant model grades it a D with a score of 32, a reading driven by price action and valuation inputs and not a comment on the businesses. But the job I gave it was to be the piece of the list that does not blow up, and by that measure it has done the job.
NextEra: cheap against its own history, and it did not help
NextEra is the name on this list that the numbers have treated worst. The shares closed at $80.47 on September 18, down 3.7% since August 26 while the proxy rose, and they sit 17% below their 52-week high of $97.30. That is a bigger drawdown than Johnson & Johnson and Berkshire combined. So much for the safe-haven label.
The valuation is the interesting half of the story. A trailing P/E of 18.1 compares with a five-year average of 34.2, which is close to half. The dividend yield is 2.96%, from $2.38 a share over the trailing twelve months. Our NextEra forecast goes through why the power-demand story is attractive and where it can go wrong. What I take from the measured data is narrower. The stock is cheap on its own history and it has been falling anyway. Interest rates, which I cannot see in this data, are the usual explanation for a utility behaving that way, and I put that forward as an inference and not a finding.
Was it a win-rate pick? Its worst day in the past year was 4.6% on May 18, which is milder than Walmart’s. But three weeks of underperformance on a list that promised stability is a fair mark against it.
Johnson & Johnson: the one that graded best, at a price
Johnson & Johnson is the outlier in the table. It is the only name of the four that the quant model rates a B (80), and it has the smallest average earnings-day move, 0.9% across its last four reports. Its daily volatility is only a touch above the proxy’s. The stock closed at $269.99 on September 18, essentially unchanged from August 26, and only 4% below its high.
The catch is what you pay. The P/E is 31.3 against a five-year average of 21.9, and the shares are 59% above their 52-week low of $170.28. The dividend yield is 1.94%. This is a stock whose calm has already been rewarded. I still hold that the resolved talc litigation, which I cannot verify from our database, removed the specific overhang I was worried about, but a resolved overhang is a reason for the stock to have risen, and it has.
The October 13 report is the one event on this list with a date attached. Johnson & Johnson is the name I would size most carefully today, precisely because it looks like the safe one.
Walmart: the bad news was delivered, and it was bigger than I said
I wrote in August that Walmart’s bad news was “already delivered on August 21.” The database dates it August 20, and puts the move at -9.2%. The prior report, in May, was a -7.3% day, and February’s was -1.4%. The oldest of the four was a rise of 6.5%. Averaged, the last four reports moved the stock 6.1% a day, more than three times Berkshire’s average.
Since August 26 the stock has risen 2.3% to $106.73, the best of the four, and yet it remains 21% below its 52-week high. The P/E is 38.7 against a five-year average of 36.8, and the dividend yield is 0.90%. Our piece asking whether Walmart trades like a software company goes into the multiple.
So does Walmart fit a win-rate-first list? On the evidence in the data, only in a narrow sense: the shock has already happened and a repeat is not scheduled inside September. On volatility and on multiple, it does not. I would keep it if I could tolerate a stock that has just shown me a 9% day, and I would drop it if I could not.
Scoring the list
Here is the honest tally for the window between August 26 and September 18. Of the four measurable names, 2 rose more than 0.05%. Berkshire gained 1.0% and Walmart 2.3%. Johnson & Johnson was flat, and NextEra lost 3.7%. The proxy gained 1.3%. Only Walmart beat it. Three weeks is far too short a window to say anything about a win rate, and nobody should treat it as evidence for or against the method.
What the window does show is that “defensive” and “did not fall” are different things. The price levels above are where a fall would have to start from, and the two names with the smallest drawdowns from their highs, Berkshire and Johnson & Johnson, are the two I would call least exposed to a single bad day.
What this screen is not doing
I am not covering the wider market risk, which no stock selection removes. If you want a way to be paid for waiting rather than to hope for a calm month, our guide to selling puts on VOO explains how a win-rate target works in an options context, and it has the opposite problem: a high win rate can conceal a loss that arrives all at once. For the rate decision that many readers were watching in the middle of the month, our Fed piece covers the trade around it.
I am also not covering Church & Dwight, for the reason already given, and I am not using dividend growth streaks, because our data does not carry them.
The dates that would grade it
October 13 is the first. If Johnson & Johnson’s report moves the stock by more than the 6% that Walmart’s reports average, then the label I put on it, the calmest name on the list, will have been wrong for a reason I should have seen in the multiple. Below the 3% NextEra’s reports average, and I will keep it as it is.
The second is a price. NextEra at $80.47 is 17% below its high, and the yield has to do the waiting for it. If it closes below its 52-week low of $69.28, I will stop calling it a win-rate name, whatever the P/E says.
Financial disclaimer: The content on StockVane is for educational and informational purposes only and should not be construed as professional financial advice. Stock market investing involves risk of loss.
Sources: Dividends (SEC Investor.gov glossary) (https://www.investor.gov/introduction-investing/investing-basics/glossary/dividend) · Dividends tax topic (IRS) (https://www.irs.gov/taxtopics/tc404)