
Sell a put every week for a year with a 95% chance of keeping the premium each time, and the arithmetic says to expect 2.6 losing weeks out of 52. The chance of getting through all 52 without one is 6.9%. Nobody putting this trade on for “safe income” hears that part first, and it is the part that decides whether the strategy works for you.
I have written about selling puts for income before, and the question I get most often is whether the broad S&P 500 funds are the right underlying for a 95% win-rate approach that still pays a double-digit annualized yield. VOO is the fund readers name, and I will answer the question about it directly. My view: the 95% part holds up on an index-like underlying and falls apart on single stocks, while the double-digit part does not show up in the option prices I can see. You usually get one or the other.
What the database can and cannot test
Start with a limit. StockVane’s database does not carry VOO or its option chain. It does hold SPDR S&P 500 ETF (SPY), which follows the same index, at $761.69 on September 18, 2.0% below its 52-week high of $777.44 and 21.7% above its 52-week low. For the back-test I built an equal-weight basket of the 300 stocks we cover, using 1,682 trading days of closes from January 2020 to September 18, 2026. It is a rougher stand-in than the cap-weighted index, more diversified by count and less top-heavy, and I will flag where that matters.
For the yield question I used the live put chain across the names where option data exists and the market is liquid enough to trade. The chain is stock options, not index options. Treat those numbers as a floor for what a low-volatility underlying pays, not as a quote for VOO.
The 95% test: how often did the basket fall through a strike?
A put sold five trading days out and struck 5% below today’s price loses money at expiry only if the underlying closes more than 5% lower. I counted every five-day window since 2020. The equal-weight basket fell more than 5% in 2.9% of them, so the win rate at that strike was 97.1%. At 8% out the basket breached in 1.1% of windows.
Now the same count on the stocks themselves. Pool all 300 names and the five-day breach rate at 5% is 10.1%, more than three times the basket’s. The ten largest companies by market value did slightly worse at 11.8%. Owning the pieces is not the same as owning the average of the pieces, because the pieces do not all fall at once.
| Downside test, five trading days | Equal-weight basket of 300 | All 300 stocks pooled | Ten largest stocks |
|---|---|---|---|
| Fell more than 3% | 7.4% | 19.0% | 21.5% |
| Fell more than 5% | 2.9% | 10.1% | 11.8% |
| Fell more than 8% | 1.1% | 4.3% | 4.7% |
| Fell more than 10% | 0.8% | 2.6% | 2.8% |
Volatility explains the gap. The basket’s annualized daily volatility over the period was 21%. The median single stock ran at 34%, and the median of the ten largest at 38%. Diversification took roughly a third off the risk, and a put seller is paid to carry exactly that risk. That is why the underlying matters more than the strike: the same 5% cushion buys about a 97% win rate on the basket and about 90% on a typical stock.
One caveat cuts against me. The window includes March 2020. The basket lost 22.2% in the five days ending 2020-03-12, and its worst peak-to-trough drop was 38.2%, bottoming on 2020-03-23. A 5% cushion is nothing in a week like that. The 95% figure describes ordinary weeks, and the tail has never respected it.
Rare weeks are still weeks, and one of them can erase a year of small premiums.
Fifty-two small bets
Here is the trap in the win-rate framing. Each trade may win 95% of the time, but a weekly seller is making 52 trades a year. The chance of at least one breach over 26 trades is 74%, and over 52 it is 93%. Using the basket’s measured 5-day rate at a 5% strike, 2.9% per trade, the odds of at least one breach in a year are still about 79%.
So a losing trade is a scheduled event, not a failure of the plan. What matters is how big it is compared with the premium collected in the wins. This is where my own rules come from: size the position so one assignment does not hurt, and decide beforehand whether you want to own the shares. I go through that process on a real trade in the Baidu cash-secured put walkthrough.
Overlapping windows are a limitation of the count. Consecutive five-day windows share four days of price action, so the 52 outcomes in a year are not independent. Breaches cluster in selloffs, which makes the “at least one” odds a little lower than the arithmetic says and the bad years worse than the average implies.
Time helps the seller less than it seems
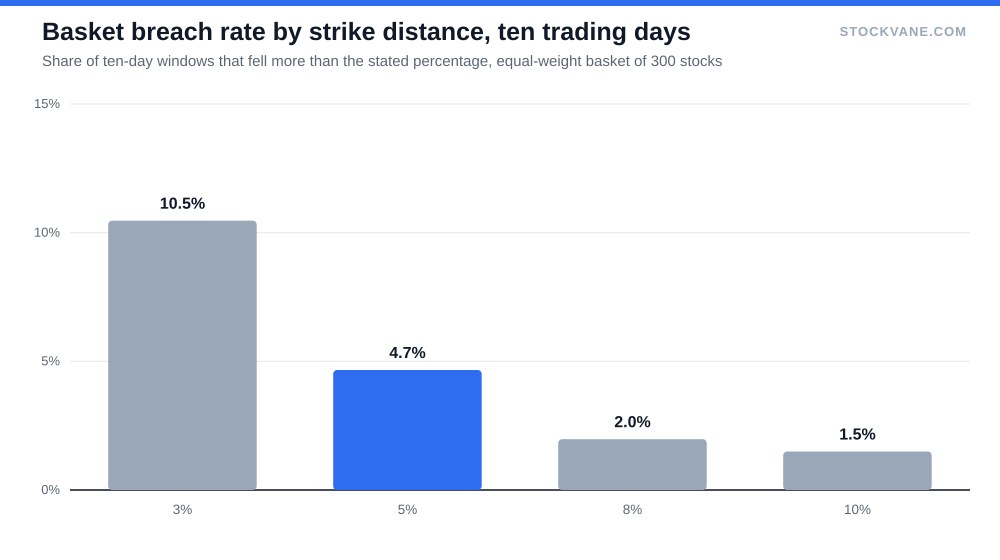
Lengthening the trade is the obvious way to collect more, and it costs win rate. Over ten trading days the basket fell more than 5% in 4.7% of windows, up from 2.9% over five. At a 3% cushion the ten-day breach rate was 10.5%, so roughly one trade in ten loses.
Twenty trading days is closer to a monthly put. The basket fell more than 5% in 7.5% of those windows, and pooled single stocks did so 20.6% of the time. A cushion of 8% took the monthly basket breach rate to 3.1%. That is where a put with a delta near 0.05 to 0.08 lives, and it is why the win rate quoted for that delta is an approximation of the market’s pricing, not a measured hit rate.
The double-digit yield is the weak leg
The old pitch for this trade says a premium of 0.3% to 0.4% of the strike every week or two compounds into 10% to 14% a year. I could not reproduce that on the chain. I took, for each optionable name with real open interest and a reasonable bid-ask spread, the put closest to a delta of negative 0.065 expiring between October 16 and November 6, roughly four to seven weeks out. That left 74 names. The median annualized premium on the strike was 5.3%, the middle half of names sat between 4.2% and 7.7%, and only 7 of the 74 reached 10%. The median strike sat 15.8% below the stock price, which is a wide cushion because these are selected as low-delta contracts.
| Underlying | Share price | Put strike | Strike below price | Mid premium | Time left | Annualized premium on strike |
|---|---|---|---|---|---|---|
| JPM | $349.67 | $310 | 11.3% | $1.10 | 28 days | 4.6% |
| COST | $895.31 | $815 | 9.0% | $1.90 | 28 days | 3.0% |
| BRK.B | $509.77 | $475 | 6.8% | $0.77 | 28 days | 2.1% |
| Median of 74 names | n/a | n/a | 15.8% | n/a | 28 to 49 days | 5.3% |
Look at what liquid, lower-volatility names pay. JPMorgan’s put at $310 sat 11.3% below the $349.67 share price and paid $1.10 for 28 days, an annualized 4.6%. Costco’s $815 put paid 3.0% and Berkshire’s $475 put 2.1%. These are the closest thing the chain has to a boring index. Boring is what makes a 95% win rate believable, and it is what keeps the premium thin.
The comparison that matters is the alternative use of the cash. After the Fed raised its target range to 3.75% to 4.00% on September 16, cash collateral parked in Treasury bills earns something near that. A 4% to 5% premium yield on a 7% breach cushion pays only a point or two above bills for taking equity tail risk. The seven names that did clear 10% are the ones where the premium is high because the market is charging for larger moves, which is the trade the 95% pitch was meant to avoid. For the rate backdrop see our note on the September 16 hike.
Where the trade breaks
Three conditions would make me stop. First, a breach that arrives with a gap: the index closing 5% lower in a day, as it did in March 2020, leaves no chance to roll. Second, a premium that no longer covers the cushion, meaning the yield on the put falls below Treasury bills for the same collateral. Third, my own behavior. Selling puts every week rewards a dull routine, and the strategy fails mostly when people start reaching for delta after a losing month.
There is also a real counter-argument that I take seriously. Index puts do carry a persistent premium over the volatility that later gets realized, which is why sellers have historically been paid for this risk. I cannot measure that in this database, since it holds no index implied volatility history. I would not lean on it as a promise. It is a tendency, and it disappears in the years when it matters.
What I am leaving out is margin, tax treatment of assignment and the choice of broker, which change results more than most readers expect. If you want a wider list of ideas built around win rate first, the September stock ideas piece applies a similar frame to individual names, though it picks stocks instead of selling premium against them.
The breach rate I would size around
I would take the 97% basket figure seriously and the 10% yield claim not at all. If you sell puts on a broad fund, expect a yield closer to the 4% to 5% the chain pays, and size the position so that one loss at roughly the 8% cushion, the point where about 2 in 100 five-day windows failed, costs you less than three months of premium. If the yield you see on the screen is above 10%, ask who is paying it and for what.
Gavin Thorne has invested in U.S. stocks for six years and previously worked at a large publicly traded internet company. He writes about income-oriented strategies, including cash-secured puts, and about how he reads company data. This article reflects his personal research process and is for informational purposes only. It does not constitute investment advice.
Sources: Dividends (SEC Investor.gov glossary) (https://www.investor.gov/introduction-investing/investing-basics/glossary/dividend) · Stock options tax topic (IRS) (https://www.irs.gov/taxtopics/tc427)