
A 0.27 turn of book value doesn’t sound like much. On Wells Fargo it is about $44 billion. That is the gap between the 1.63 times book the stock trades at and the 1.9 times the industry averages, applied to a company worth roughly $260 billion. Closing it is the whole bull case, and the question is whether the bank has earned the right to close it.
For a long stretch, the answer was no. A Federal Reserve order capped the bank’s total assets at about $1.95 trillion, and it stayed in place while every other large US bank was free to add deposits and loans. The Fed lifted that cap in 2025. What I want to know is what the numbers look like now that it is gone, and my read is that the stock is cheap against its peers and not cheap against its own past.
Cheap against peers, expensive against itself
The valuation tab puts price-to-book at 1.63. The five-year average is 1.26, and the top of the five-year band is 1.52, so today’s multiple sits above anything the stock has averaged over that stretch. Against the 1.9 industry figure it looks discounted. Against its own history it looks full. Both statements are true, and the trade depends on which comparison you trust.
Earnings tell the same mixed story. The trailing P/E is 12.5, close to the five-year average of 12.2 and well under the industry’s 14.9. So on earnings the discount to peers is real, about 16%, and the discount to itself is nil. If you believe a bank that spent years under a growth ban deserves a lower multiple until it proves otherwise, this is roughly where that belief lands.
Price-to-sales tells the same story with a smaller gap: 3.1 times against a five-year average of 2.6 and an industry figure of 3.9. Every yardstick puts the stock at or above its own history and below its peers. That is what a market says when it thinks a company is improving but wants to see the proof.
I lean toward that belief. A cap is not just a limit on assets. It shapes how a bank prices loans, which customers it courts and how much it spends on the systems that support growth. Seven years of running with the valve shut leaves habits, and habits don’t reset on the day an order is lifted.
What the income statement shows
Revenue was $83.7 billion in fiscal 2025. That compares with $82.6 billion in 2023 and $74.3 billion in 2020, so the top line has gone nowhere in three years and has grown only about 13% in five. Net income, on the other hand, reached $21.36 billion, or about 25.5 cents of every revenue dollar. Diluted EPS rose from $4.83 in 2023 to $5.37 and then $6.26, a 17% jump in the latest year.
Flat revenue with rising profit is a cost story, and buybacks help the per-share figure too. It is efficient, but it has a ceiling. You can only trim so much before growth has to do the work, which is why the recent quarters matter. The most recent quarter brought $22.62 billion, up 10% on the year and 5.5% above the quarter before, which was $21.45 billion and up 6%. Revenue is finally moving.
Earnings at a bank are not a smooth line, and this one has the history to prove it. Net income was $3.66 billion in 2020, jumped to $23.8 billion in 2021 and fell back to $13.38 billion in 2022. The 2021 figure is the peak in our data, and the 2025 result of $21.36 billion is about 10% below it. So the company has not yet earned more than it did at the top of the last cycle, which is worth remembering when someone calls the current profit a record.
One quarter is not a trend. I would want to see two more like it before I called the cap’s removal a growth event rather than a good quarter.
Where the money comes from
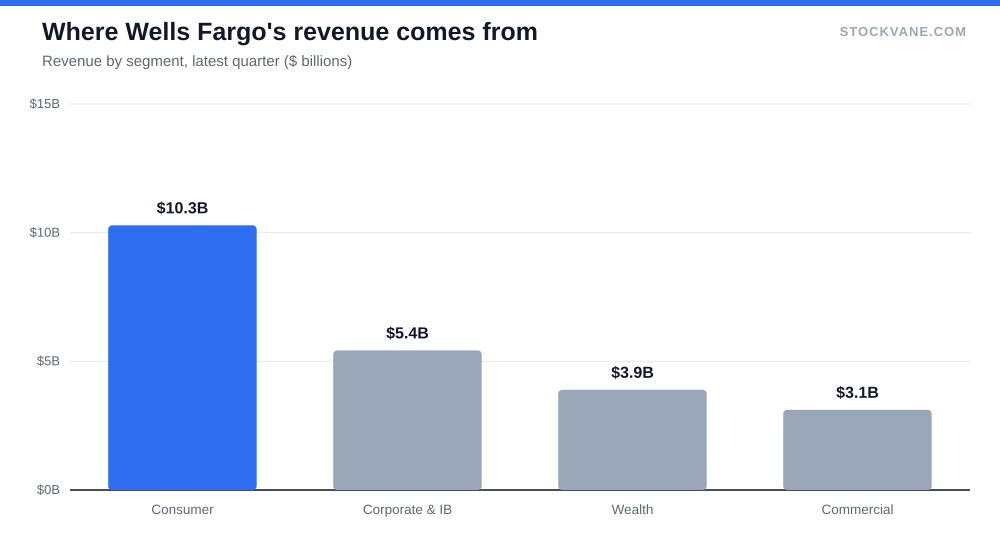
The latest quarterly segment split shows a bank leaning on the consumer. Consumer banking and lending brought in $10.3 billion, about 45% of the four main segments. Corporate and investment banking followed at $5.4 billion, then wealth and investment management at $3.9 billion and commercial banking at $3.1 billion.
That mix is different from JPMorgan, which I covered when it hit a record. Wells Fargo has a bigger share of its earnings tied to households, so the forecast leans more on the consumer credit cycle and on where the Fed takes rates. With the Fed having just raised rates, as I covered in the piece on the September meeting, a bank with a large deposit base gains on the spread but has to watch funding costs and credit quality.
There is a practical reason the segment mix matters after the cap. A bank that can finally grow its balance sheet has to choose where to put the new capacity: consumer loans, which are steady and heavily competed, or corporate and trading businesses, which pay more in good years and hurt in bad ones. Management’s choice will show up first in which of these four lines grows fastest over the next two reports, and I would watch corporate and investment banking against the $5.4 billion base above.
Investment banking and wealth are where the room to grow is largest, because those are the businesses the cap made hardest to scale. That is speculation on my part. I don’t have segment margins in our data, so I cannot say which of the four earns the most on each dollar.
What the stock did on reports
The last three earnings days were all declines: -2.7%, -5.7% and -4.6%, an average of about 4.3% down. Our data does not tie those moves to any single cause, and I won’t invent one. What it shows is that the market has been selling into good-looking results, which is common when expectations have crept up before the report. The next report is on October 13.
The stock is about 10% below its 52-week high of $96 and 19% above the low of $72. The dividend yield is 2.09%, which is small next to the total return a holder needs. This is not an income stock in the way an old-school bank stock used to be. It is a bet on the multiple.
Analysts and the model disagree, mildly
Of the 15 analysts covering the stock, 60% rate it a buy and 40% a hold, and none say sell. The analyst page shows an average target of $101, about 17% above the price. The lowest target is $90, only 5% above, and the highest is $115, up 34%. A floor that close to the price tells me that even the cautious analysts don’t expect the stock to fall much.
Our quant model is less friendly. It rates the stock a D with a score of 34, down from a D at 49 on September 8. A D on the model means weak momentum and fundamentals against the rest of the market, not a call that the bank is in trouble. I read the two views together as “fine business, not a fine chart.”
| Metric | Value | Context |
|---|---|---|
| Price (approx.) | $86.12 | 52-week range $72 to $96 |
| P/E (TTM) | 12.5x | Five-year average 12.2x |
| Price-to-sales | 3.1x | Five-year average 2.6x |
| Analyst ratings | 60% buy, 40% hold | 15 analysts; average target $101 |
| Dividend yield | 2.09% |
A grid for the price
I don’t trust a single price target for a bank, so here is a grid instead. Analysts’ forward P/E of 12.0 implies about $7.17 a share over the next year, against about $6.88 over the last twelve months. That is a small step up, around 4%, which fits a bank still working through cost cuts.
| Forward EPS Multiple | 11x earnings | 13x earnings | 15x earnings |
|---|---|---|---|
| $6.30 a share | $69 | $82 | $94 |
| $7.20 a share | $79 | $94 | $108 |
| $8.00 a share | $88 | $104 | $120 |
At the current price the market pays about 12 times my middle earnings case of $7.20. The middle row and the 12.2-to-14.9 range of multiples give a spread of roughly $88 to $107. It takes a miss on earnings and a lower multiple together to get to the $69 corner, and that is the case I would want to be protected against.
The risk that would make me wrong
The main risk is straightforward. Credit losses rise, deposit costs stay high, and the bank’s revenue growth fades back to flat. In that world the multiple stays where it is, or falls back toward the five-year band’s lower end, and the stock has no reason to close the peer gap. I also can’t rule out a regulatory surprise. I don’t have any current data on remaining consent orders, so I would not want to size this as if regulators were done.
Short sellers are not betting on that outcome. Only 1.1% of the float was short at the end of August, with about 2.9 days to cover. That is a quiet position, and it means the stock’s weakness is not a squeeze story in either direction.
The number I would circle on October 13
Everything above comes down to whether revenue growth of around 10% survives another quarter. If the report shows it does, with earnings near the $7.20 my grid uses, I would treat the peer discount as real and the stock as fairly priced at $86. If revenue growth slides back toward 5%, the cap’s removal was a story and not a change.
For an income approach, the setup is more comfortable. I would only consider a cash-secured put around $78, about 9% below the price and 10.8 times my earnings case, above the 52-week low. My put approach is laid out in the guide to selling puts. Below $78 I would be happy to own it, and above that I would rather wait for the report.
Gavin Thorne has invested in U.S. stocks for six years and previously worked at a large publicly traded internet company. He writes about income-oriented strategies, including cash-secured puts, and about how he reads company data. This article reflects his personal research process and is for informational purposes only. It does not constitute investment advice.
Sources: Dividends (SEC Investor.gov glossary) (https://www.investor.gov/introduction-investing/investing-basics/glossary/dividend) · Dividends tax topic (IRS) (https://www.irs.gov/taxtopics/tc404)