
In fiscal 2025 Johnson & Johnson reported net income of $26.8 billion on an operating income of $25.6 billion. Net income was larger than operating income. That almost never happens at a healthy industrial company, and it tells you the last three years of this income statement cannot be read line by line.
The title of this piece says two overhangs cleared, and I mean it narrowly. The consumer business is gone, and the legal charge that hit 2024 has not repeated in the 2025 numbers. What the statements show, and what I can defend, is that operating income rose from $21.25 billion in 2024 to $25.60 billion in 2025 while revenue grew 6%. The stock has priced that in (the financials tab has the full series). At $270, it sits 3.9% below its 52-week high of $281, and the question for a buyer today is what remains to be paid for.
My view: the business is better than it was two years ago, the shares now cost more than the business has earned them the right to, and the next entry point is lower than the screen price. I will walk through the margin, the earnings quality, the valuation and the case against me, in that order.
The margin that came back
Operating margin, meaning operating income divided by revenue, was 25.8% in fiscal 2023 ($22.01 billion on $85.16 billion). It fell to 23.9% in 2024 ($21.25 billion on $88.82 billion), a drop of about 190 basis points in a year when sales rose. In 2025 it recovered to 27.2% ($25.60 billion on $94.2 billion). That is 140 basis points above the 2023 level, so the recovery is not a return to normal. It is a new high for this six-year record.
I use operating income here because the database also carries an EBIT margin of 35.6% for 2025, a much bigger number. The gap between them is the same thing that pushes net income above operating income: non-operating items. I will not quote the EBIT figure as a margin, and I would be wary of anyone who does.
Gross margin tells a quieter story. It slipped from 69.1% to 67.9% in 2025. So the operating improvement came from below the gross line, from spending and one-off charges, not from making each dollar of product more profitable. I read that as real but less durable than a gross-margin gain would have been.
Earnings you have to sort before you trust
Look at net income across six years: $14.7 billion in 2020, $20.9 billion, $17.9 billion, then $35.2 billion in 2023, $14.1 billion in 2024 and $26.8 billion in 2025. Diluted EPS follows the same path, $13.72 in 2023, $5.79 in 2024 and $11.03 in 2025. A company with a steady pharma and device franchise does not double and then halve its profit on operations. Something other than operations is moving reported profit.
The 2023 spike lines up with the year the consumer health division was separated, and the 2024 collapse lines up with the year the filing showed operating income falling while net income fell by 60%. I have not read the footnotes for the individual items, and this piece does not claim to have sorted them. The safe reading is that only the operating line is a clean guide, and that reported EPS is a poor base for a multiple.
That matters because of what the snapshot does next. Trailing earnings per share is $8.62 over the last four quarters, below the $11.03 of fiscal 2025. Trailing P/E is 31.3. Forward EPS is $12.57, which implies growth of 46% from the trailing figure. Nobody should take a 46% jump at face value. Part of it is the trailing number carrying charges that analysts exclude.
| Metric | Value | Context |
|---|---|---|
| Price (approx.) | $269.99 | 52-week range $170 to $281 |
| P/E (TTM) | 31.3x | Five-year average 21.9x |
| Price-to-sales | 6.5x | Five-year average 4.7x |
| Analyst ratings | 78% buy, 22% hold | 18 analysts; average target $287 |
| Dividend yield | 1.94% |
The multiple versus its own history
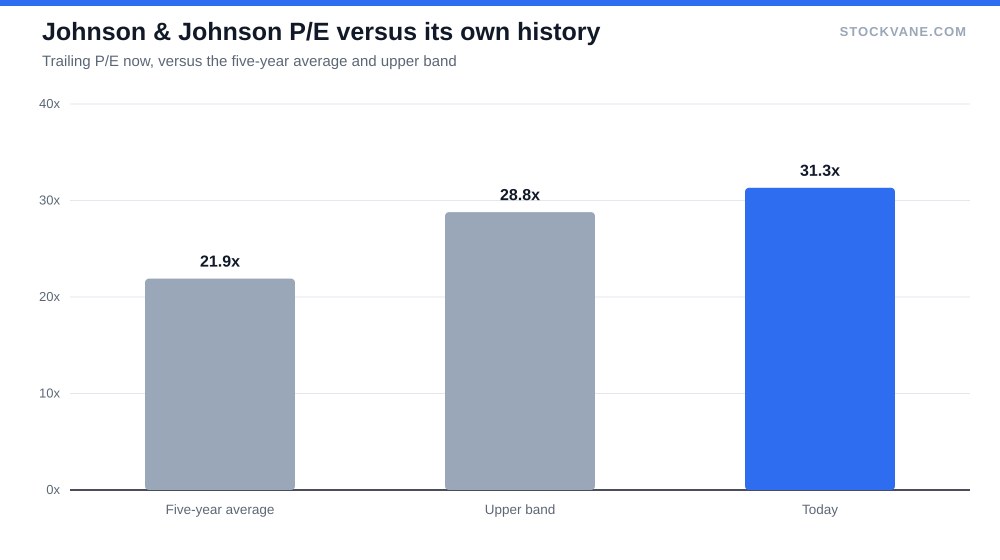
The valuation tab puts the P/E at 30.8 against a five-year average of 21.9, which is 1.4 times its own history and the 88th percentile of its five-year band (15.0 to 28.8). Price to sales is 6.5 against 4.7, the 98th percentile. Price to book is 7.5 against 5.8, also the 98th.
Forward P/E is the outlier at 21.5, roughly level with the five-year average of 21.9. Everything depends on which earnings you believe. On trailing numbers the stock is expensive for its own history. On forward numbers it is merely fair. The industry average P/E in our data is 29.3, so J&J sits slightly above its industry on trailing and well below it on forward.
Price to sales is harder to argue with because revenue does not carry one-off items. Investors pay 6.5 times sales, when the five-year average is 4.7 and the top of the band is 5.4. That is a multiple above anything the last five years offered, on a business growing revenue around 6% a year.
For context, our piece on JPMorgan at 15 times earnings makes the opposite case: a record-high stock that still looked reasonable because the multiple was low. J&J at a record-adjacent price with a multiple above its band has less room for error.
Who is buying, and what they expect
The analyst desk is constructive. Of 18 analysts, 78% rate the stock a Buy, none rate it a Sell, and the average target is $287, 6% above the price. The range is wide: $260 at the low end, which is -4% from here, and $320 at the high, 19% above. A 6% upside to the average target does not compensate for a 31 times trailing multiple.
The StockVane quant rating moved from a C on September 8 to a B (score 80) as of September 20. That is a rating change in twelve days, and I would not lean on it, but it agrees with the improving operating line.
Short interest is 0.9% of float, about 3.3 days to cover. Nobody is betting against this stock in any meaningful size, which is what you would expect for the twenty-first largest company in our coverage at $650.6 billion. There is also an insider sale in the news feed from September 4, disclosed at $9.23 million. At a company this size it is noise, and I mention it only so you do not find it later and think I hid it.
Two divisions, one growth rate
The latest segment split is Innovative Medicine at 64.7% of quarterly revenue ($16.38 billion) and MedTech at 35.3% ($8.93 billion). Total revenue in the most recent quarter was $25.3 billion, up 7% from a year earlier, and that puts the annualized run rate at $101.2 billion. Quarterly growth rates have run 7%, 9%, 10% and 7% over the last four quarters. That is steady, and steady is the whole thesis for a stock at this size.
Compare it with the managed-care story in UnitedHealth’s margin crisis, where the debate is whether margins have bottomed. J&J’s margin has already turned. What separates them is that J&J’s recovery is priced, while a stock still in trouble is not.
The pharmaceutical side also faces the question every large drugmaker faces: what replaces the products that lose exclusivity. Our look at Eli Lilly and the obesity market shows what a growth franchise looks like when the market sizes it aggressively. J&J has nothing quite like that in our data, which is the honest reason its growth stays in the mid single digits.
The case against me
Here is the argument that I am too cautious. Revenue is growing, the operating margin is at a six-year high, and forward P/E is 21.5. If analysts are right that earnings come in near $12.57, the stock at $270 costs about 21 times next year’s profit, which is close to its five-year average for a business that is now cleaner than it was. Add a 1.94% dividend yield ($5.24 per share) and a quant score that just moved up, and a buyer today is not being reckless.
I do not dispute any of that. My objection is to the price of the margin of safety. The trailing-earnings gap is real, the price-to-sales multiple is at the top of its band, and the stock is 3.9% from its high with an average target only 6% away. If the forward numbers are wrong by even 10%, the forward P/E goes to 24 and the stock has neither growth nor cheapness to lean on.
What I am not covering is the legal side beyond the 2024 hit in the numbers, and drug-by-drug patent timing. I cannot verify either from the database, and a guess would be worse than silence.
How I would use this
The dividend is small. At $5.24 a share it pays 1.94%, less than most people can get from a savings account, so owning J&J for income is a mistake. I would treat it as a quality compounder bought at a fair price, and the price is the variable.
For someone who sells puts, as I do on names I would happily own, the analyst low target of $260 is a sensible strike reference: it is about 4% under the current price, close to the lower end of the range, and near where the multiple would come back toward its history. That is a lower-risk way to be paid while waiting than buying at $270. It is not a recommendation, and it depends on your account size and your tolerance for being assigned.
A number that would reopen the debate
The third-quarter report is due on October 13. Last quarter the stock moved -2.7% the day after the print, and the average move over recent reports is 0.9%, so the market does not usually punish or reward this company sharply. If revenue holds near $25 billion and the operating margin stays above 26%, I would lean toward paying up. The quote page will carry the new figures the day they file. If the margin drops below 25.8%, the 2023 level, the recovery will look like a one-year event and I would want the stock closer to $250.
Gavin Thorne has invested in U.S. stocks for six years and previously worked at a large publicly traded internet company. He writes about income-oriented strategies, including cash-secured puts, and about how he reads company data. This article reflects his personal research process and is for informational purposes only. It does not constitute investment advice.
Sources: Johnson & Johnson SEC filings (EDGAR) (https://www.sec.gov/cgi-bin/browse-edgar?action=getcompany&company=johnson+%26+johnson&type=10-K&dateb=&owner=include&count=10).