
Between fiscal 2022 and fiscal 2025, CSX gave up $0.76 billion of revenue and $1.07 billion of operating income. Revenue went from $14.85 billion to $14.09 billion, a drop of 5.1%. Operating income went from $5.79 billion to $4.72 billion, a drop of 18.5%. Profit fell 3.6 times as fast as sales.
A toll road is not supposed to do that. The whole point of owning fixed track is that the price of passage rises even when fewer vehicles show up. So the title of this post is a claim I have to test rather than repeat: is CSX a toll road with a traffic problem, or a business whose tolls have stopped covering its costs?
My answer is the first, but with a qualifier the stock price does not yet respect. The pricing franchise looks intact in the recent quarters. The margin it produces is still well below where it was three years ago, and at 27.2 times trailing earnings the stock is priced as if that gap has already closed.
What the toll road label assumes
The same label turns up in our piece on Visa and the argument there is worth borrowing here: a toll road earns money on volume times price, and the interesting question is always which of the two is carrying the result. For a railroad the price side is the more durable one. A shipper with a coal plant or a chemical facility on a single line has no realistic alternative, so rates move up with inflation and a bit more.
The volume side is cyclical and, for CSX, has been weak. Revenue is down in each of the last three fiscal years: $14.9 billion in 2022, $14.7 billion in 2023, $14.5 billion in 2024 and $14.1 billion in 2025. Two of those steps were only 1% each. The last one was 3%.
Here is the limit of what I can say. The database I work from carries revenue, not carloads, so I cannot split that decline between fewer shipments and lower revenue per shipment. What I can do is look at what happened to profit while revenue slid, because that is where a working toll shows up.
Where the toll stopped covering the cost
On the financials tab, gross margin tells the story. It was 38.95% in fiscal 2022, 37.71% in 2023, 36.74% in 2024 and 33.25% in 2025. That is 5.7 percentage points lost in three years, and 3.5 of them arrived in the most recent year alone.
Operating margin (operating income over revenue) shows the same path: 33% in fiscal 2025, against 39.0% in fiscal 2022 on the same arithmetic. The database’s own EBIT margin measures slightly differently and reads 32.7% for 2025, so I will stick to the operating figure from here on.
Read that chart as a cost story more than a demand story. If lower traffic were the whole problem, a railroad with fixed costs would still see margin fall, but revenue is only 5% below 2022. A profit decline of 18% on a revenue decline of 5% says costs per unit of revenue went up while the tolls were being collected. Wage settlements, fuel, network repairs and the price of keeping service reliable are the usual suspects, but the database does not break them out and I will not pretend it does.
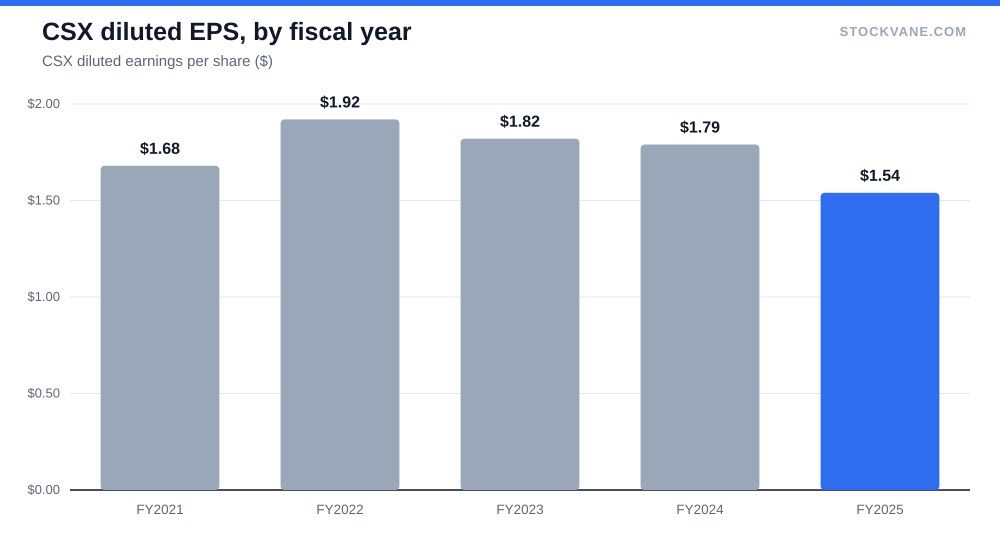
Net income tells the same thing with more drama. It fell from $4.11 billion in fiscal 2022 to $2.89 billion in 2025, a 30% drop, and diluted earnings per share went from $1.92 to $1.54. Trailing twelve-month EPS is now $1.73, which is the first sign of recovery in that column.
The recent quarters make the best case
The fiscal 2026 quarters are the reason the title still holds. Revenue for the latest quarter, reported on 2026-07-22, was $3.9 billion. That is 10% above the same quarter a year earlier and 13% above the prior quarter. Quarterly revenue had been shrinking 1% year over year in the two quarters before that, then rose 2%, then 10%.
Annualise the latest quarter and you get $15.7 billion, above the $14.85 billion of fiscal 2022 that started the decline. One quarter is not a trend, and I read it cautiously: the database gives me no volume data and no acquisition history, so I cannot say how much of the jump is shipments, how much is pricing and how much is something else. But it is the fastest quarterly growth in the four quarters the database shows.
The segment table for that quarter is worth a look. Rail brought in $3.71 billion, or 94.3% of the total, and a trucking line added $229 million, 5.8%. The mix says the recovery, whatever its source, is coming from the core railroad rather than from a side business.
After that report the shares rose +5.8% after that report, against an average earnings-day move of 4.2%. The quantitative grade on the stock is B now and was D on September 14.
The price assumes the margin comes back
At $47.10, CSX trades 11.9% below its 52-week high of $53 and 45% above its low of $32. The market value is $87.3 billion. The trailing P/E of 27.2 sits at 1.37 times its own five-year average of 19.8, and the current reading is in the 91st percentile of its own history.
Price to sales tells a similar story on the valuation tab: 6.0 times, against a five-year average of 4.9. Book value gives 6.2 against 5.4. All three gauges say the stock is expensive relative to how CSX itself has traded.
Against the sector the picture softens. Industry average P/E is 25.1, and CSX at 27.3 is only a little above it. On forward earnings of $2.11 per share, the multiple drops to 22.3, which is below that industry figure. The forward number needs 22% earnings growth to happen, and that is where the whole argument sits.
Put differently: the stock is cheap against its peers only if you believe the $2.11 forecast, and expensive against its own history if you do not. I keep going back and forth on this. The forecast is plausible given the latest quarter. It is also a forecast that assumes the margin drop of the last three years stops.
A comparison from a different sector shows how the market handles this kind of question. In UnitedHealth’s margin crisis the debate was also about whether a compressed margin had found its floor. The lesson I take from both is that the market pays for the recovery before the recovery shows up in the annual numbers, and punishes it if the next quarter disappoints. A related point about paying for the label rather than the numbers is in the Walmart post.
| Metric | Value | Context |
|---|---|---|
| Price (approx.) | $47.10 | 52-week range $32 to $53 |
| P/E (TTM) | 27.2x | Five-year average 19.8x |
| Price-to-sales | 6.0x | Five-year average 4.9x |
| Analyst ratings | 74% buy, 21% hold | 19 analysts; average target $54 |
| Dividend yield | 1.15% |
Who is buying the recovery
Nineteen analysts cover the stock, and 74% rate it a buy. The average target is $54, 15% above the price, with a range from $32 to $60. The lowest target sits 32% below the price and the highest is 27% above it. A range that wide for a railroad tells me even the professionals do not agree on how much of the margin returns.
Short interest is low, at 2.2% of float, so nobody is making a large bet against the recovery. The dividend yield is 1.15% on $0.54 a share over the last twelve months. That is a small payment relative to the price, and I would not buy this stock for income.
The counter-case I take seriously
The bear case is simple and I cannot dismiss it. Revenue has fallen three years running, profit has fallen faster, and a 10% quarter does not cancel that. If the latest quarter came from a one-off (a customer’s catch-up shipments, a price adjustment that will not repeat), the multiple has nothing to stand on. At 27.2 times earnings, a stock does not get many second chances.
There is also a limit to the toll road idea itself. Pricing power lets a railroad pass on inflation. It does not stop labor and network costs from growing faster than the rate increase, which is exactly what the gross margin line suggests happened in fiscal 2025.
What I am not covering here is the merger question, service-metric detail and coal versus intermodal volume mix. The database does not hold reliable data on them, and a post that guessed would be worth less than one that admitted the gap.
The traffic number that would settle it
Watch the next two quarterly reports for one thing: whether operating margin climbs back toward 37.7%, the 2023 level, while revenue keeps growing. A margin near 33% on rising sales would mean the toll works and the cost problem is fixed. A margin still at 33% or lower on $15.7 billion of run-rate revenue would mean the last quarter was traffic without the toll, and 27.2 times earnings would be too much to pay for it. I would call the title right if the first case shows up by the fiscal 2026 annual report.
Financial disclaimer: The content on StockVane is for educational and informational purposes only and should not be construed as professional financial advice. Stock market investing involves risk of loss.
Sources: Dividends (SEC Investor.gov glossary) (https://www.investor.gov/introduction-investing/investing-basics/glossary/dividend) · Dividends tax topic (IRS) (https://www.irs.gov/taxtopics/tc404)