
Trikafta and Kaftrio brought in $2.50 billion in the June 2026 quarter. Casgevy and Journavx, the two products people point to when they talk about Vertex after cystic fibrosis, brought in $126 million between them. That is a ratio of about 20 to 1, and it is the fact I would put next to a headline saying the company’s next act has arrived.
The title of this post says the next act is not cystic fibrosis anymore. On the revenue line, it still is. Cystic fibrosis products, counting Trikafta, Alyftrek and the smaller CF lines, made up 96.2% of the segment revenue the database records for that quarter. Casgevy was 2.2916% and Journavx 1.4877%. My position is that the next act is real as a plan and unproven as a business, and the stock at $508 already carries a premium for a transition whose first numbers are small. I will make that case with the numbers and then say what would prove me wrong.
A franchise that keeps growing
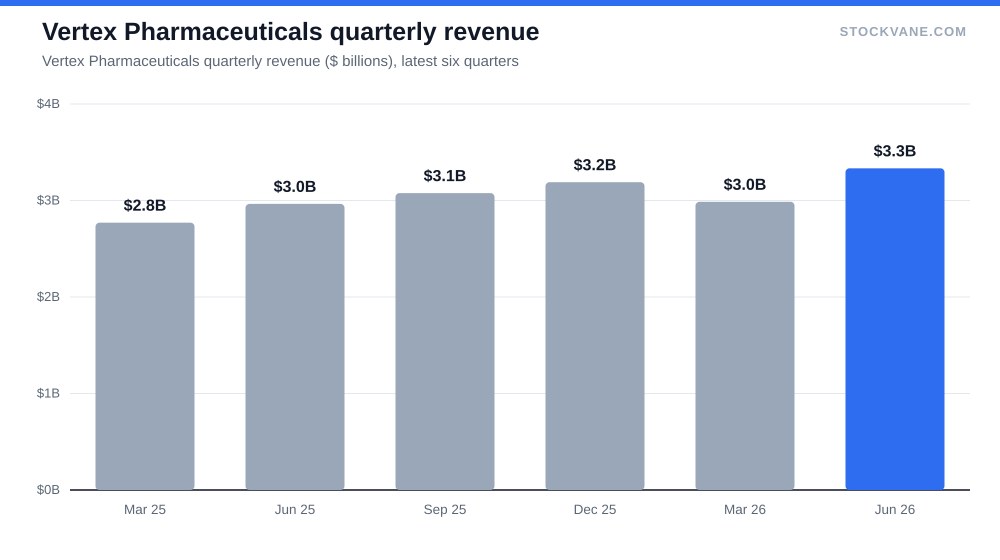
Vertex’s revenue rose from $8.9 billion in 2022 to $9.9 billion in 2023, $11.0 billion in 2024 and $12.0 billion in 2025. Growth rates over those years: 18%, 11%, 12% and 9%. That is a slowing curve, but from a large base, and the most recent quarter, $3.3 billion, was up 12% on a year ago and 12% on the March quarter. Quarterly revenue ran $3.08 billion, $3.19 billion, $2.99 billion and $3.33 billion across the last four reports. Annualized, the latest quarter gives $13.3 billion.
Gross margin has been almost flat: 88.1% in 2020, 86.1% in 2024 and 86.2% in 2025. The slide from the 88% level is a point or two, and it has not moved since 2024. For a company selling drugs at this scale, that stability says the pricing is holding.
Growth like this from a single disease area is unusual. Cystic fibrosis is a rare condition, and the treatable patient pool is finite. The company has kept expanding sales by moving more patients onto its medicines, reaching younger age groups, and launching new versions of the same drug. That last item is the one to look at, because it complicates the title.
The new product is another CF drug
Alyftrek was $573.6 million in the June quarter, 18% of the combined Trikafta, Alyftrek and other CF lines. It is the largest of the recent launches by a wide margin. It is also a cystic fibrosis medicine. When I read the segment list, I do not see a diversified company taking shape. I see a company moving its patients from an older CF product to a newer CF product.
That has consequences for how I read growth.
| Metric | Value | Context |
|---|---|---|
| Price (approx.) | $508.34 | 52-week range $374 to $560 |
| P/E (TTM) | 29.6x | Five-year average -19.3x |
| Price-to-sales | 10.3x | Five-year average 9.8x |
| Analyst ratings | 88% buy, 8% hold | 24 analysts; average target $579 |
Small numbers, large gap. Some of the 12% year-over-year rise may be new patients, some may be switching, and the database does not split them. If a growing share of Alyftrek sales comes from patients who were already on Trikafta, then the incremental revenue is smaller than the launch number suggests. I would not claim this is happening, because I have no data on it. It is the question I would ask on the earnings call.
The bull’s reply is fair. A successor drug extends the life of a franchise, and a longer franchise life is worth money. If Alyftrek shifts Vertex’s CF business onto a newer patent estate, the cliff moves out. That is a legitimate way to grow into the next decade. It just is not what the title claims.
The 2024 hole in the numbers
Operating income was $4.25 billion in 2022, $3.78 billion in 2023, a loss of $0.23 billion in 2024, and $4.55 billion in 2025. Net income tells the same story: $3.32 billion, $3.62 billion, a loss of $0.54 billion, then $3.95 billion. Diluted EPS went from $13.89 to -$2.08 to $15.32. Revenue rose in every one of those years.
The database does not give the cause of the 2024 dip. A large one-time charge is the likeliest explanation for a swing that size in a business with an 86% gross margin, and in biotech that charge is often acquired research and development expensed at closing. Treat that as my reading rather than a fact from the data. The financials tab is the place to confirm it.
Two margin figures need a caveat. Operating income divided by revenue gives 38% for 2025, and the DB’s EBIT margin is 38.8%. They come from different line items. I use operating income when I talk about dollars and the EBIT series when I talk about the trend, which ran 51.2% in 2020, 36.9% in 2021, 48.0%, 44.8%, then 2.5% and 38.8%.
What the price asks you to believe
Trailing P/E is 29.6. Forward P/E is 52.1. Trailing EPS is $17.17 and the forward estimate is $9.77, a gap of 43%. Read alone, that would say analysts expect profit to fall by nearly half. I do not believe they do. The likelier explanation is that the forward estimate absorbs a charge, in the same way that 2024 did, and that the trailing figure was flattered by a clean year. The database does not tell me which, so I would not build a thesis on the 52.1. I would put more weight on the sales multiples, which do not depend on the charge. Price to sales is 10.3 against a five-year average of 9.8 (68th percentile of its range) and 9.3 on forward sales, with an industry average of 9.6. Price to book of 6.4 matches the five-year average of 6.4.
So on sales, Vertex is valued about where it has traded for five years and about in line with its industry, at a market value of $128.8 billion. There is no discount for a franchise with a finite patient pool, and no large premium for the next act. The market is treating it as a compounding pharma business.
Analysts agree. Of 24 covering it, 88% rate the stock a buy, and the average target of $579 is 14% above the price. The range is $350 to $672, or -31% to +32% from here. A low target that far below the price tells me one analyst is pricing a bad outcome. The quant rating is C and has been there for weeks, which is not a signal in either direction. Short interest is 1.8% of float. Earnings days barely move it: +1.7% on the August 3 report against an average of 2.4%. This is a low-volatility stock around its reports.
For a comparison of how a forecast keeps expanding when a new market opens up, see the Eli Lilly obesity post. Lilly’s case rests on a market that grows the pie. Vertex’s case rests on finding a second pie.
The counter-case, and what I am not covering
The bull case for the title is simple. Casgevy is a gene therapy for blood disorders, and Journavx is a pain medicine, and either could grow quickly from a small base. At $76.4 million and $49.6 million in one quarter, they are early launches, and early launches look small. Total non-CF revenue of $126 million against $3.33 billion is 3.8% today. If those two doubled every year for three years, they would still only reach about $1008 million a quarter, which is roughly 30% of the current quarterly total. That is arithmetic on today’s split, not a forecast, but it shows how long the road is.
I am not covering the pipeline. The database holds no trial data and I will not guess at readouts. What I can measure is what has reached the income statement, and the answer is 3.8 cents of each revenue dollar.
The bear case is that the finite patient pool caps CF growth. Revenue growth has already decelerated from 18% to 9% over three years, and the 12% of the latest quarter interrupts that slide without reversing it. If growth in the next report falls below 8% while non-CF products stay under 5% of revenue, the premium sales multiple would have to be justified by something other than the current mix.
The Casgevy line I would wait for
The next report is due November 2. It will be the first with two full quarters of the new launches on the same footing. I would look at three lines. Casgevy above $150 million in a quarter would double the current figure and start to make the non-CF segment matter. Journavx keeping pace would tell me the second launch is not a one-quarter story. And total non-CF share above 6% of segment revenue, up from 3.8%, would be the first evidence I would accept for the title. Until then I read Vertex as a strong cystic fibrosis company priced at about 10.3 times sales, waiting for a second business to appear in the numbers.
Gavin Thorne has invested in U.S. stocks for six years and previously worked at a large publicly traded internet company. He writes about income-oriented strategies, including cash-secured puts, and about how he reads company data. This article reflects his personal research process and is for informational purposes only. It does not constitute investment advice.
Sources: Price-to-earnings ratio (SEC Investor.gov glossary) (https://www.investor.gov/introduction-investing/investing-basics/glossary/price-earnings-pe-ratio) · Earnings reports (SEC Investor.gov glossary) (https://www.investor.gov/introduction-investing/investing-basics/glossary/earnings-report)